Introduction
Pixel Perfect Reports is a powerful tool for creating, managing, and outputting reports. Whether you’re generating financial summaries, invoices, operational metrics, or any other type of business intelligence report, Pixel Perfect Reports provides a robust framework to design and deploy your reports efficiently. If you're new to Pixel Perfect Reports, don't worry—this blog post will guide you through the steps to create your first report.
Flexibility in Creating a Report
One thing that differentiates Pixel Perfect Reports from its peers, such as SQL Server Reporting Services (SSRS), Crystal Reports, or other SQL reporting tools, is that it does not require a definitive, prescribed method for creating a report. For example, in SSRS, you must strictly adhere to specific steps to create a report: first, you define your datasource; then, you create a dataset; and finally, you design the layout. These steps must be followed in their exact order. In contrast, Pixel Perfect Reports does not have these constraints; you can design the layout without first having a datasource.
Creating a Sales Report
Here we present one way to create a sales report listing a Sales Order ID field, an Order Date field, and a Total Amount field in the last month.
Step 1: Creating a new report.
Click the New Summary Report button to add a new report.
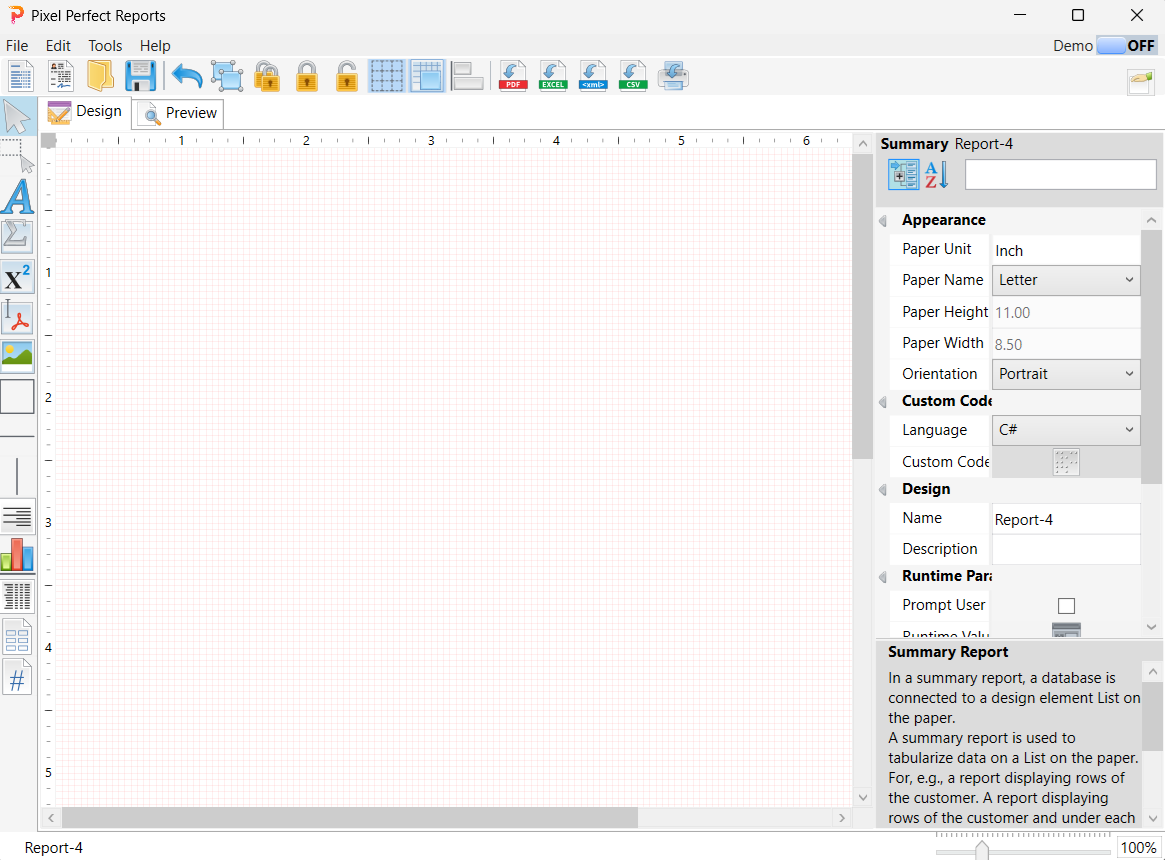
Step 2: Adding a report title.
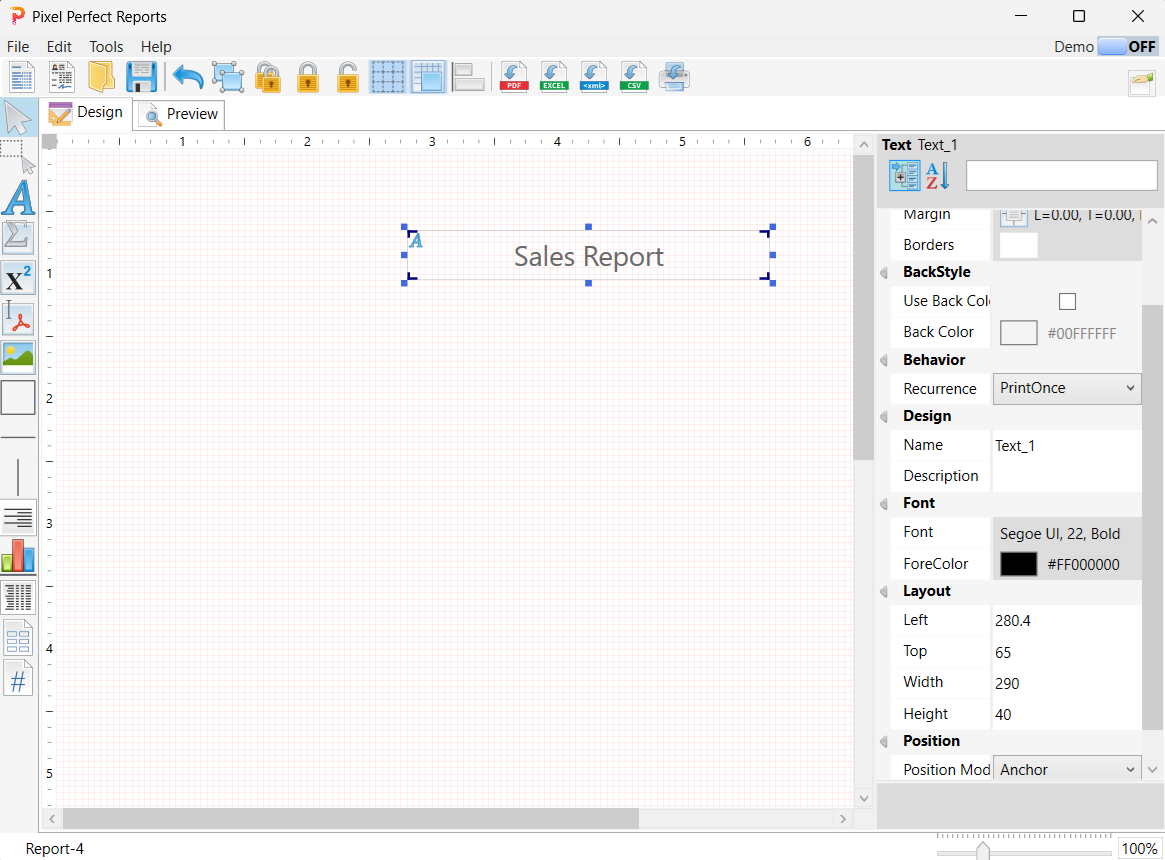
Click the text button, resize and position it at the top center of the canvas. Double click on it and set the text to Sales Report.
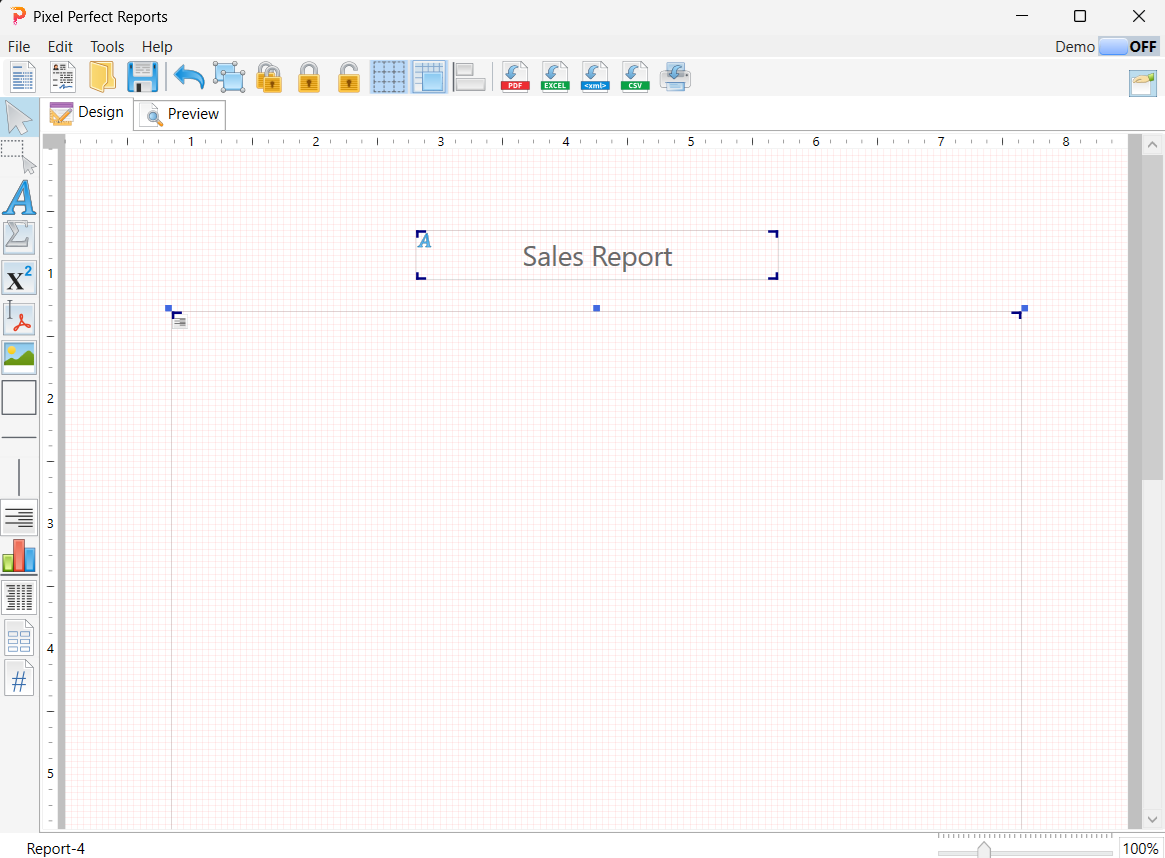
Step 3: Adding a list.
Click the list button, resize and position it at the center of the canvas.
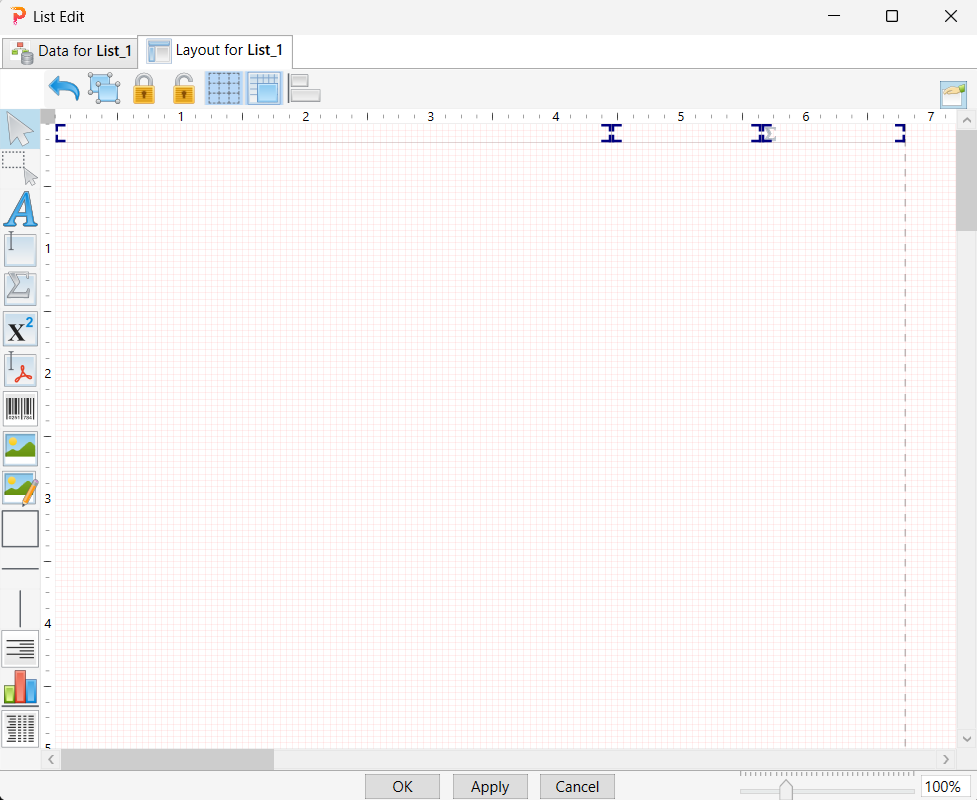
Step 4: Adding text fields.
Double-click the list. Add three text fields and position them at the top of the list.
Step 5: Adding a data source.
In the Designer, go to Tools → Add Data Source. In the Reference Database dialog, follow the instruction to add a data source.
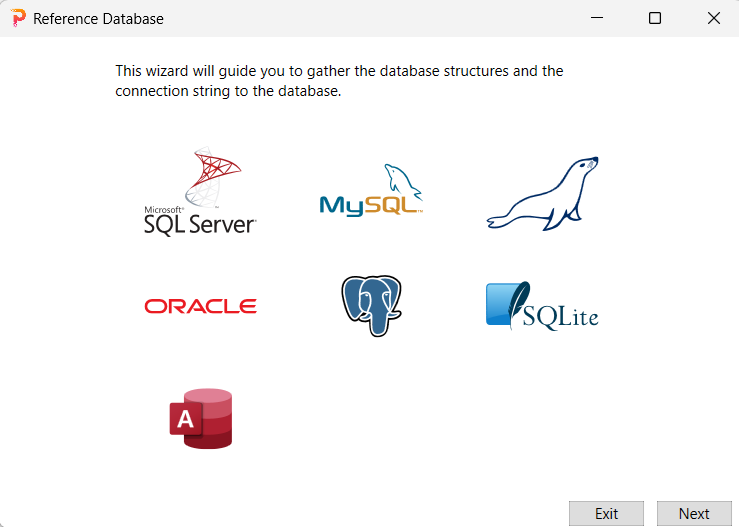
Step 6: Attaching the data source to the list.
In the Designer, double-click the list and go to the Data tab.

Click the Database icon at the left end of the row to navigate to the SQL Clauses tab.

Attach the data source to the list.

Select Customers by clicking on the 'Customers' node.

Step 7: Assigning text fields value with database columns.
Go to the Layout tab.
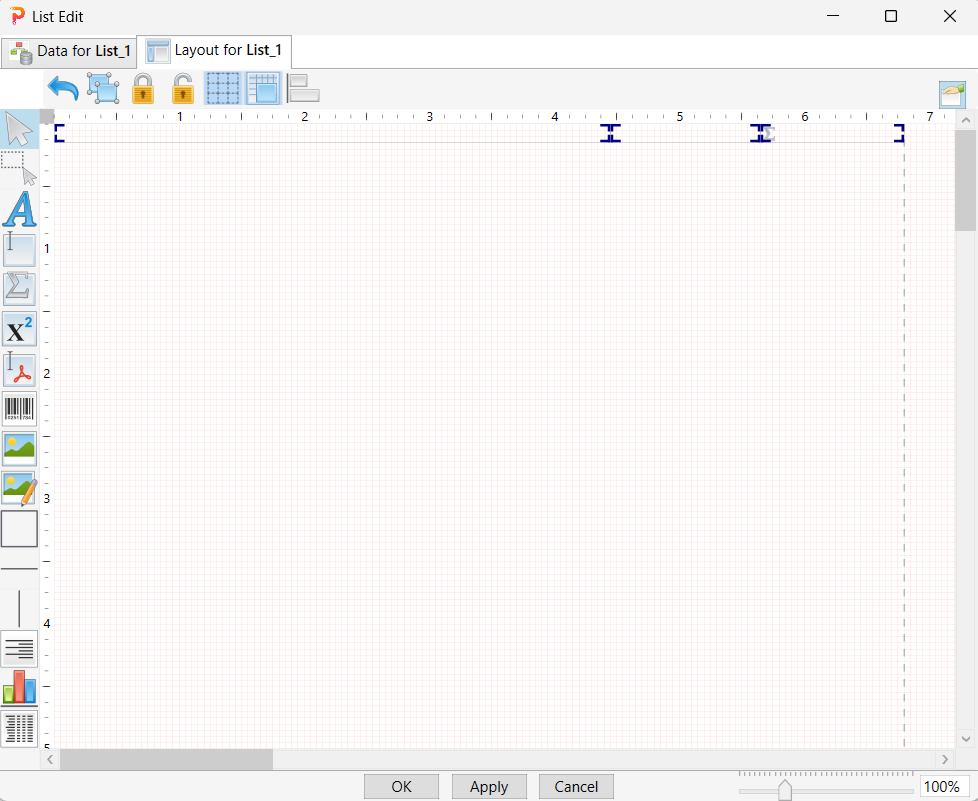
Double-click on the first text field.

Click the brick icon at the left end of the row and go to the Join tab.
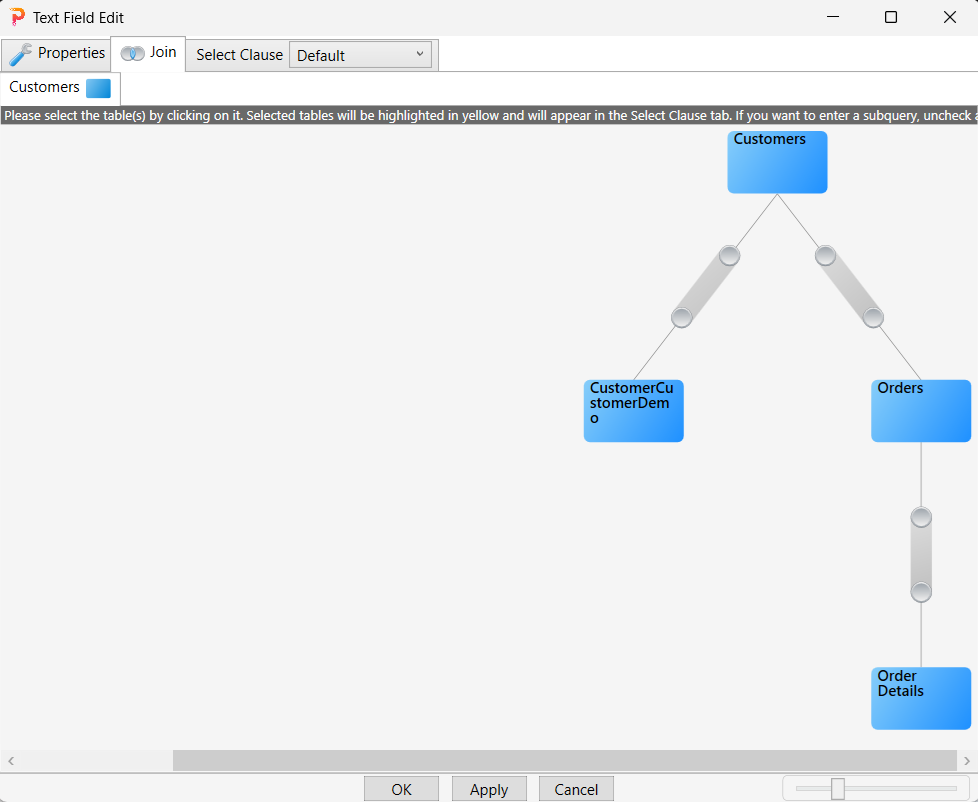
Select the Customers node by clicking on it.

Go to the Select Clause tab and double-click 'CompanyName' in the left pane to add `Customers`.`CompanyName` to the right pane.

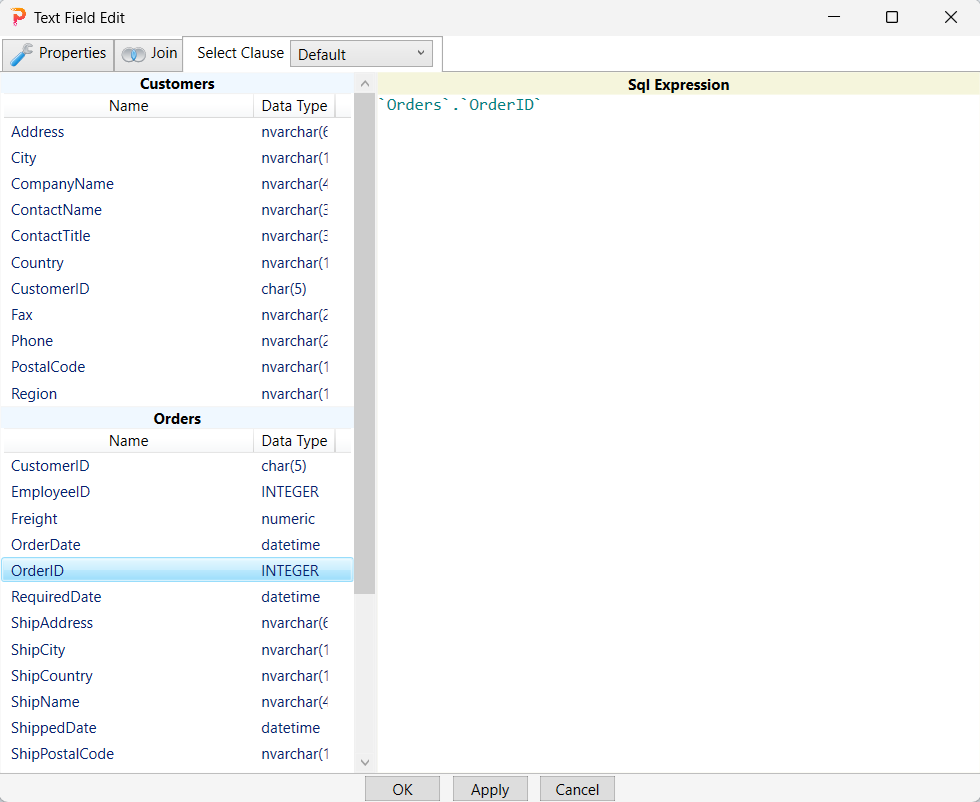
Repeat the same procedure for the second and the third text fields. For the second text field, select the Orders node.
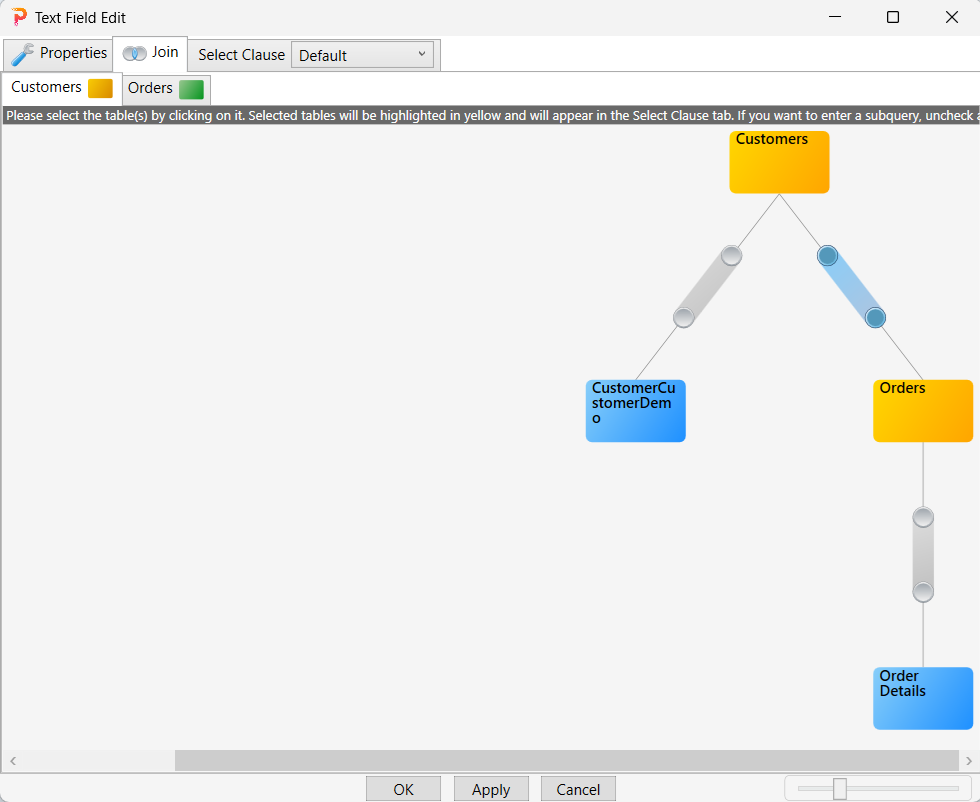
Go to the Select Clause tab and double-click 'OrderID' in the left pane to add `Orders.OrderID` to the right pane.
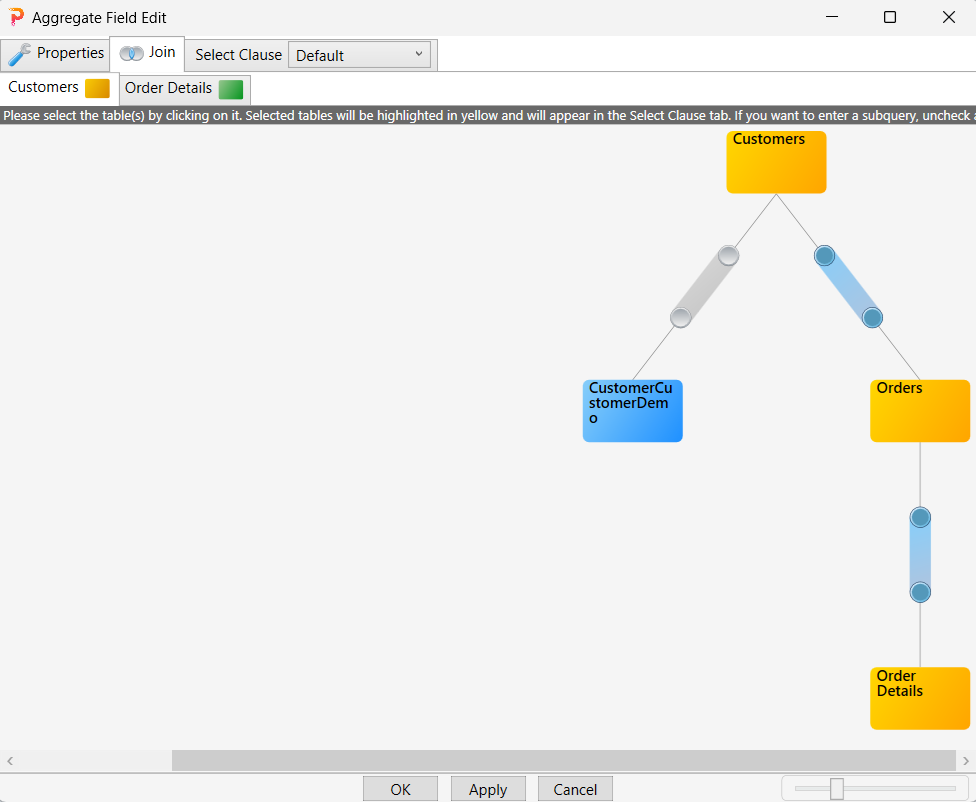
For the third field, select the Order Details node.
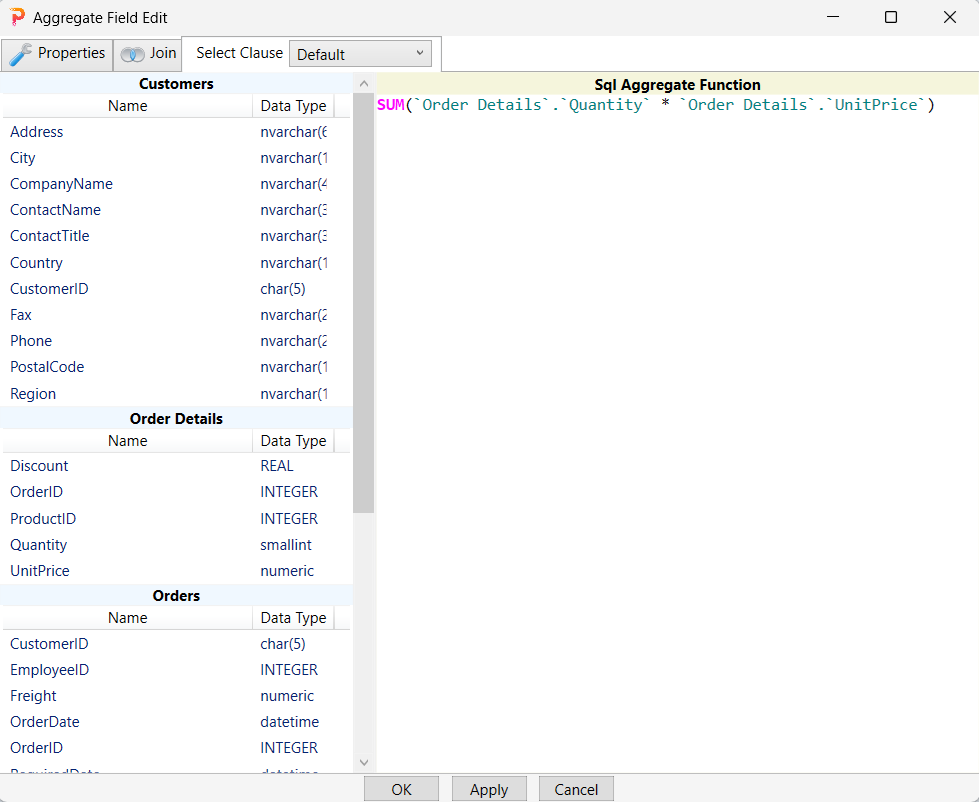
Go to the Select Clause tab and enter the expression in the right pane as shown below.
Step 8: Previewing your report.
In the Designer, go to the Preview tab to view the report. Note that only ten customers are shown. This is because, by default, the SQL query selects the top ten rows. You can, of course, edit the SQL query as needed.

Step 9: Saving your report.
Click the Save button in the designer to save the report.
Conclusion
Congratulations! You've just created your first Pixel Perfect report. With Pixel Perfect Reports, you can continue to refine your reporting skills by exploring different features. By mastering these features, you'll be well-equipped to deliver insightful and actionable reports that drive business success.