Introduction
Pixel Perfect Reports Designer is a WYSIWYG tool that provides a design area as a freeform canvas, allowing users to position elements such as text and text fields in any arrangement. In this blog post, we will demonstrate how to create a report with two lists positioned side by side and compare this approach to that of SQL Server Reporting Services (SSRS) and other SQL reporting tools.
Create a new report and add a title and page number
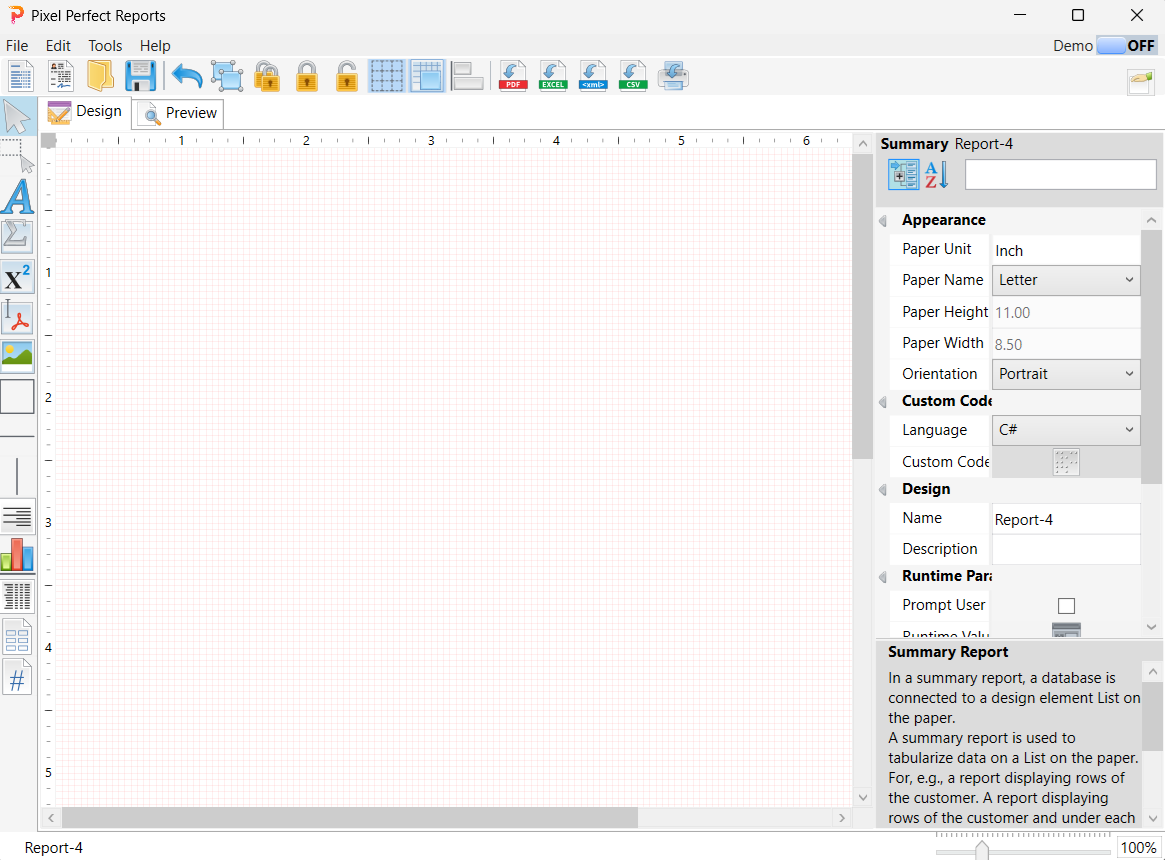
Add a list to the canvas and position it to the left of the canvas
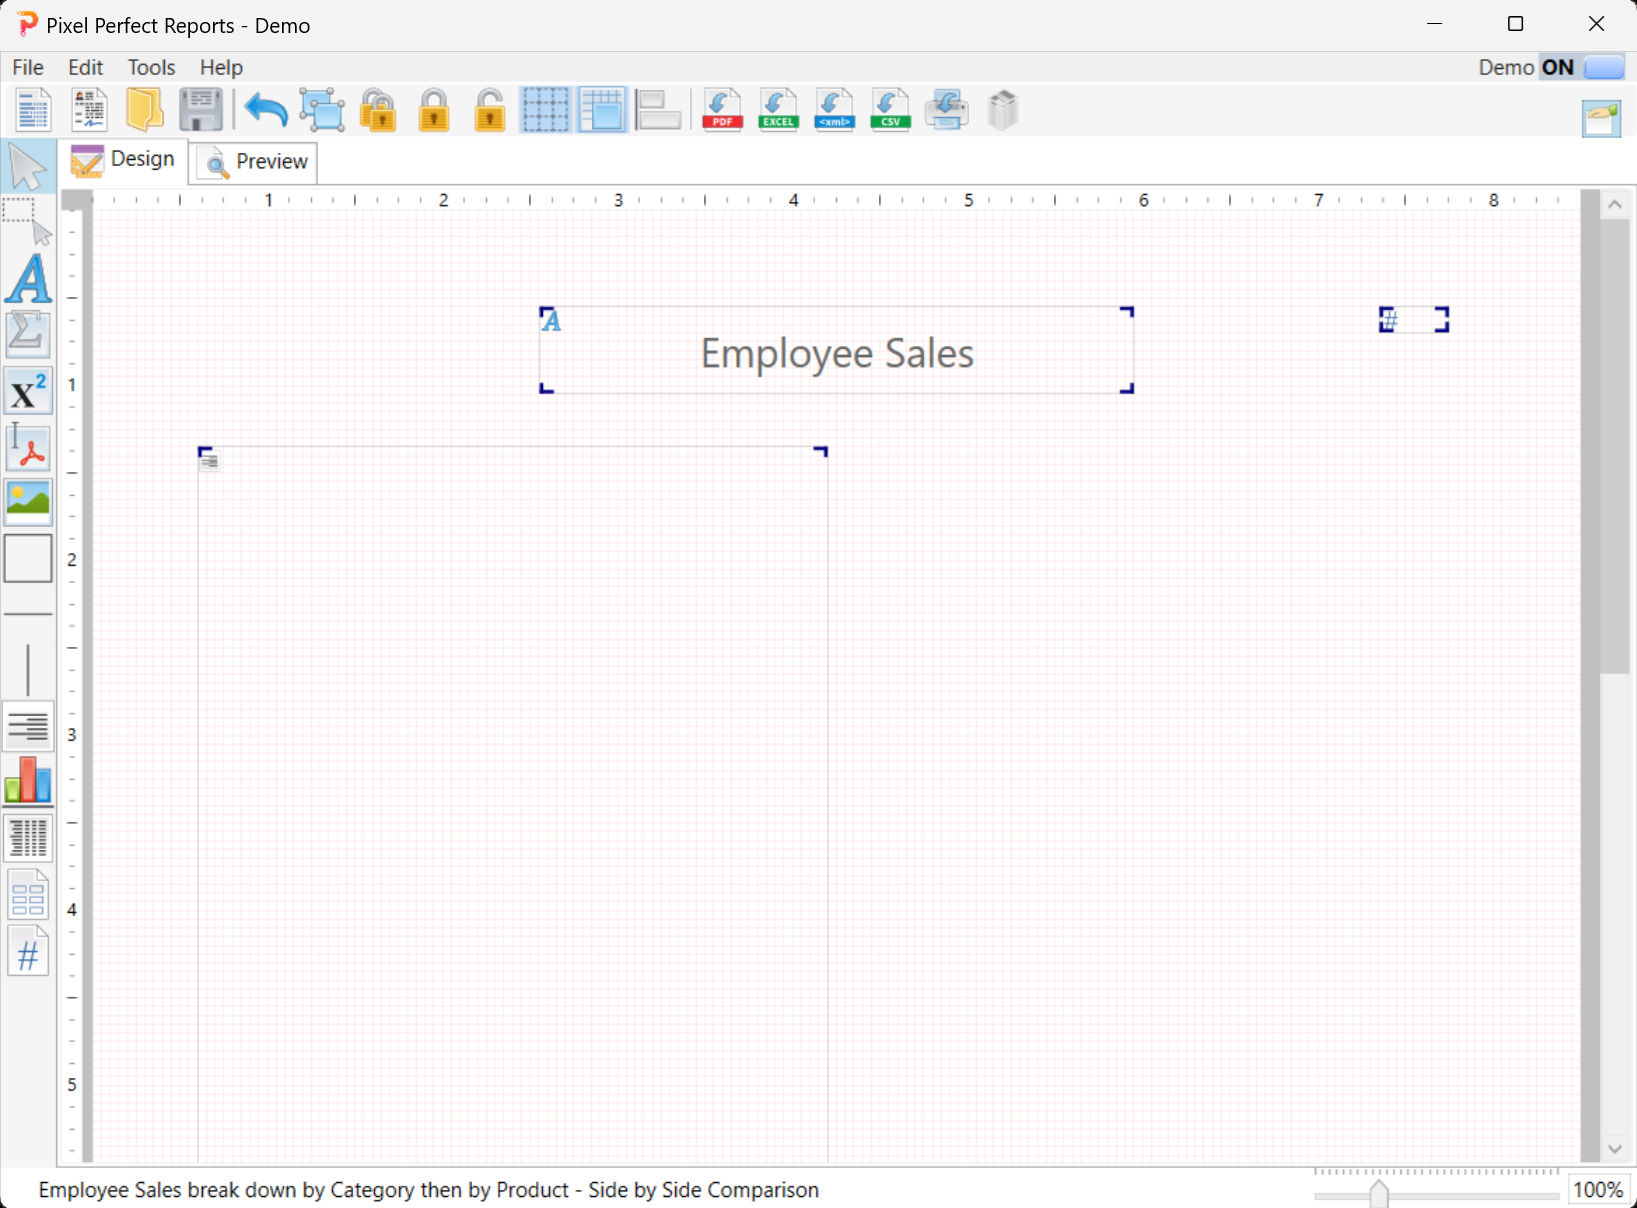
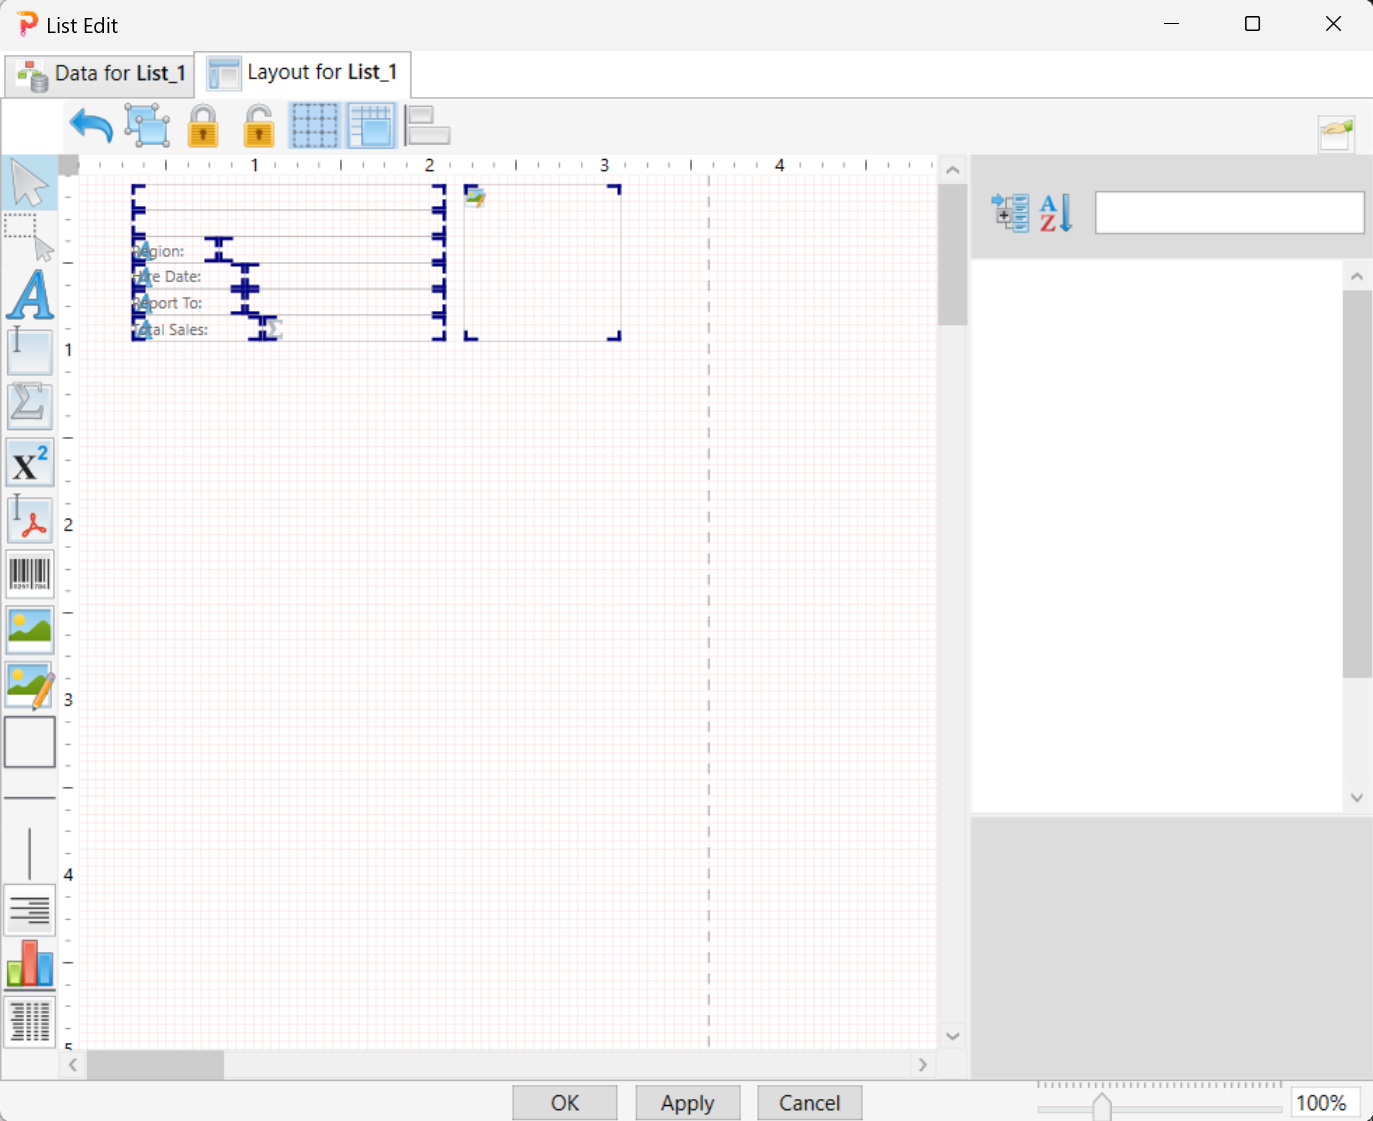
Double-click the list, go to the Layout tab, and add various elements such as text, text fields, and image fields
Go to the Layout tab, click the Database button and attach a database to the list
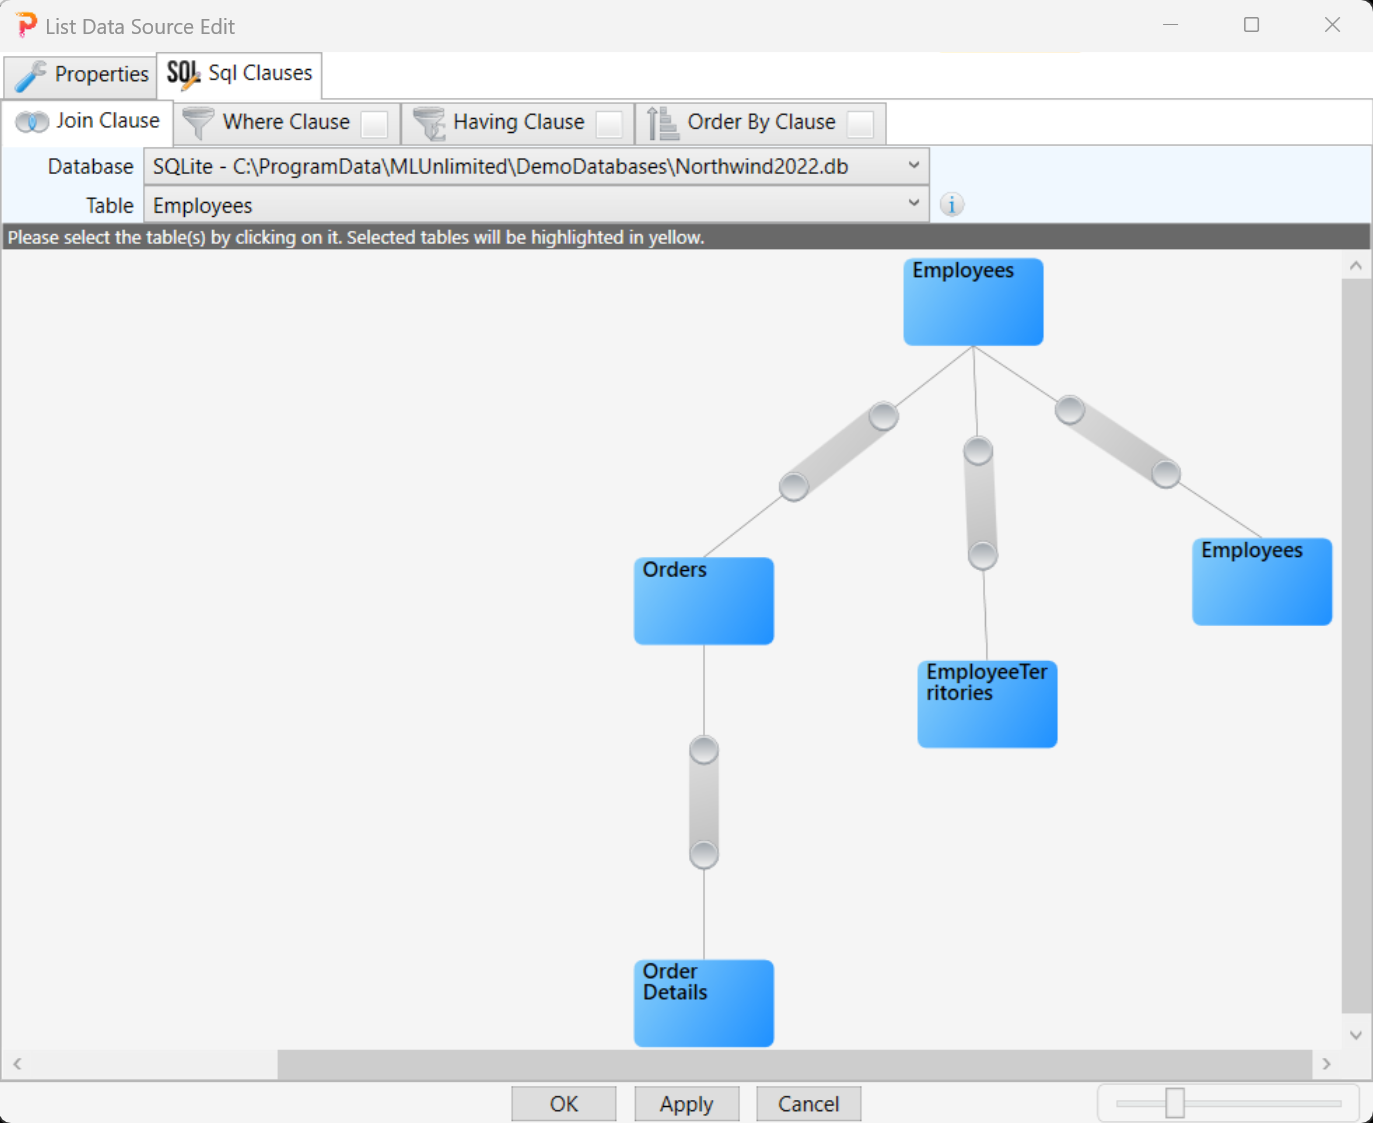
Select the Employees by clicking on the Employees node
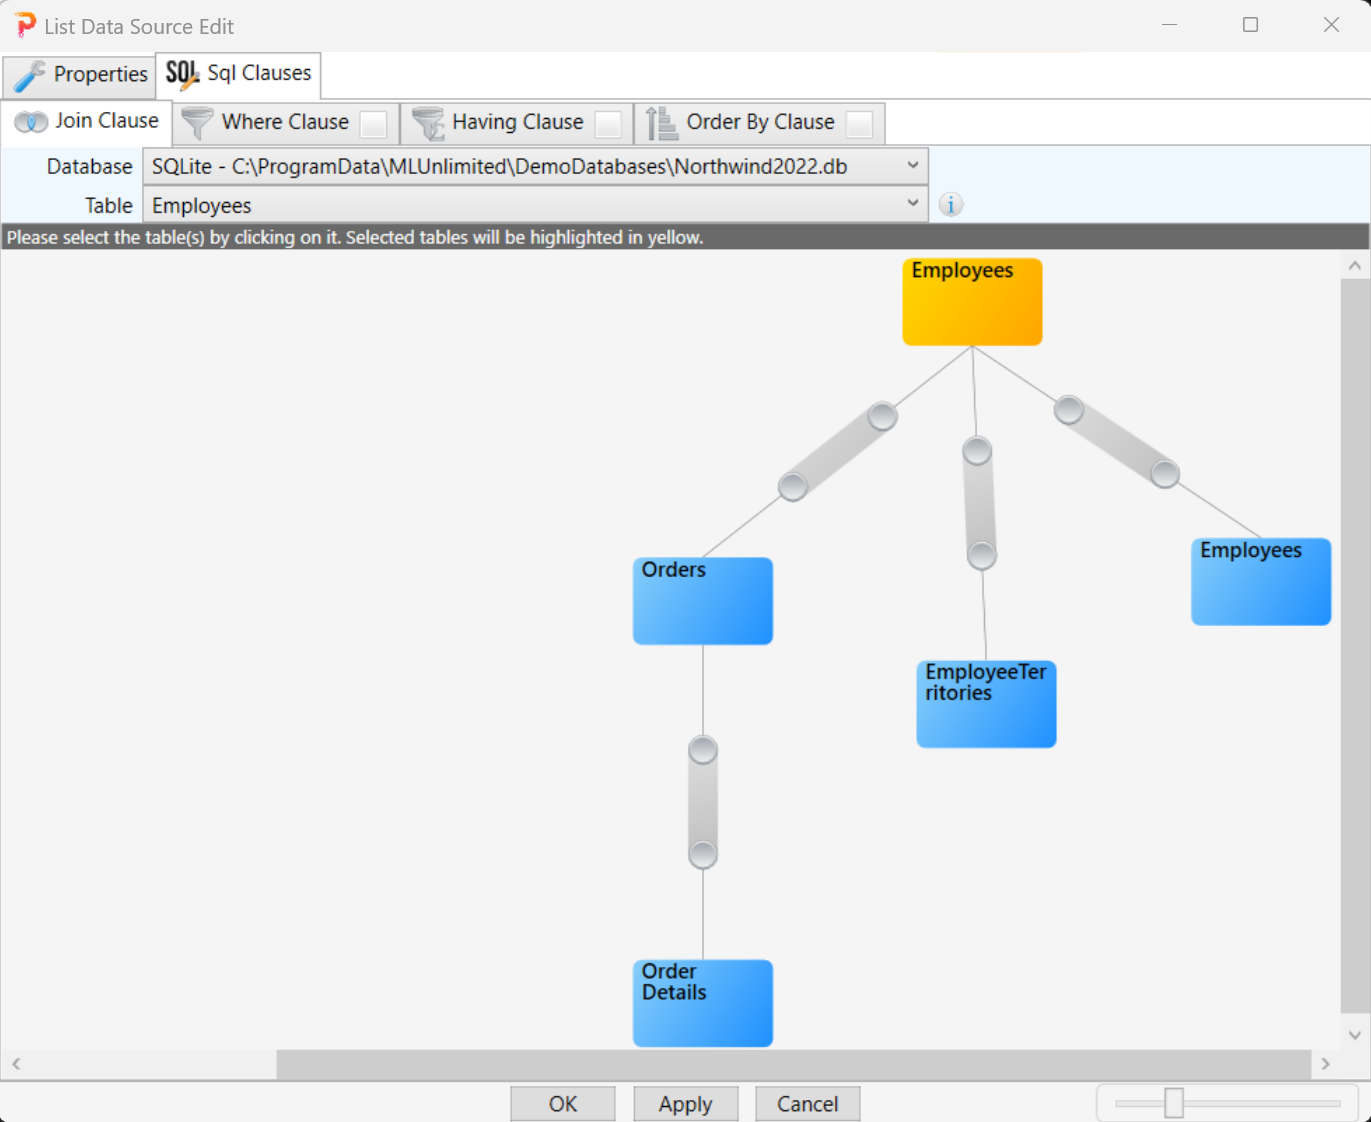
Go to the Where Clause tab and construct a flowchart as shown
This flowchart is to select a particular employee. Right now, there is no predicate in the predicate node. We will add the predicate in the predicate node later.

Set up the Runtime parameters
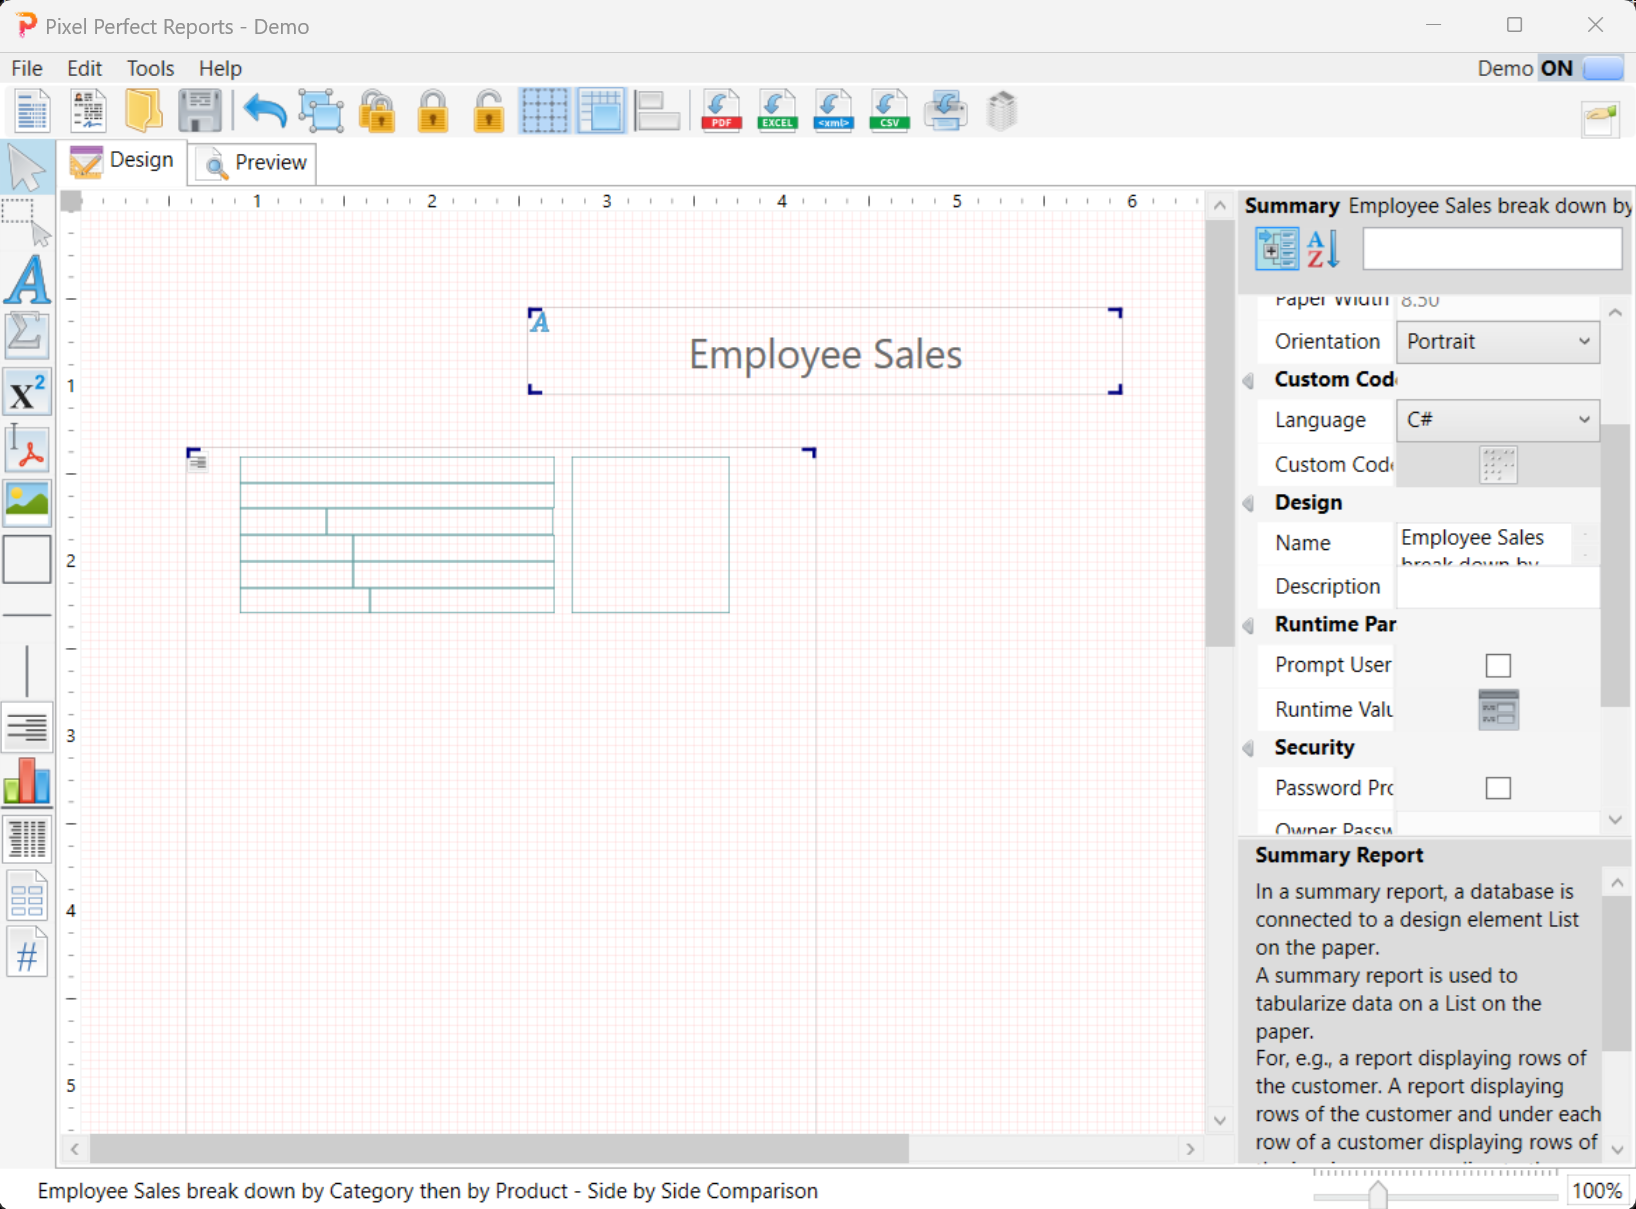
Click all the OK buttons to go to the designer.
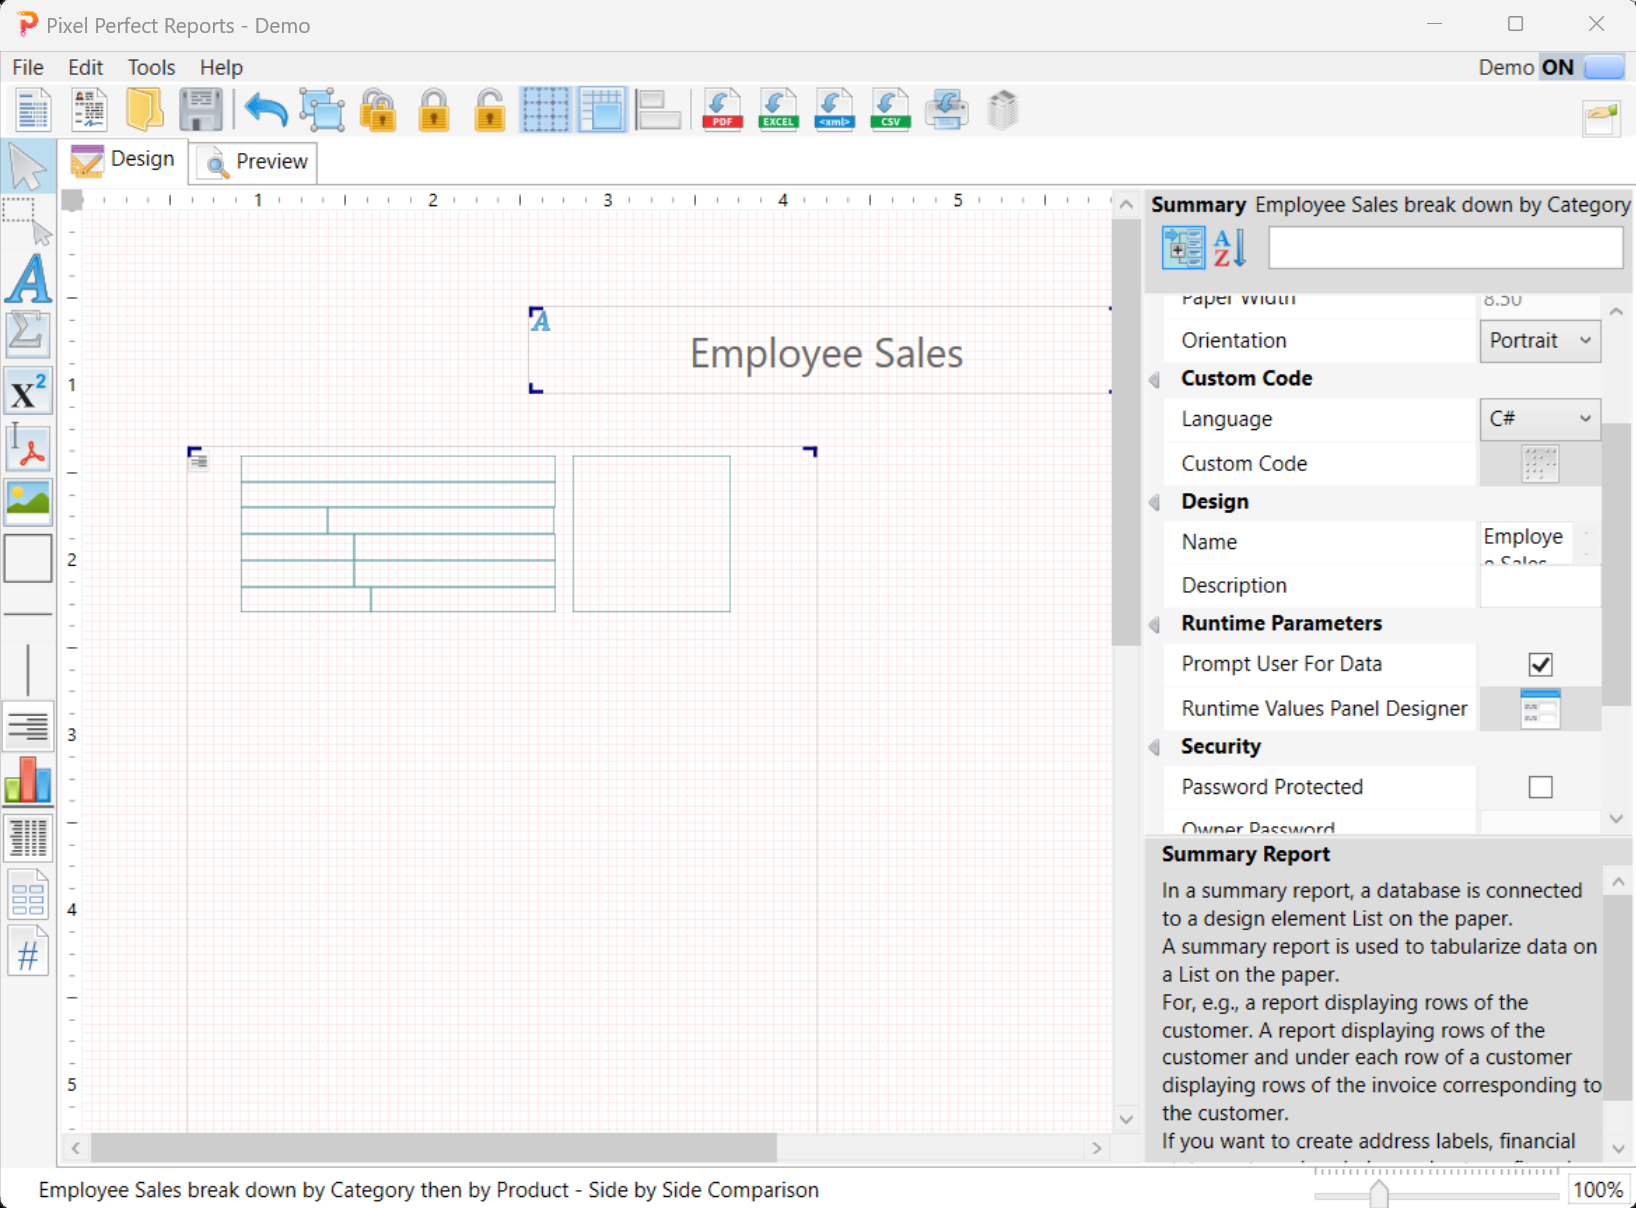
Check the Prompt User For Data checkbox.
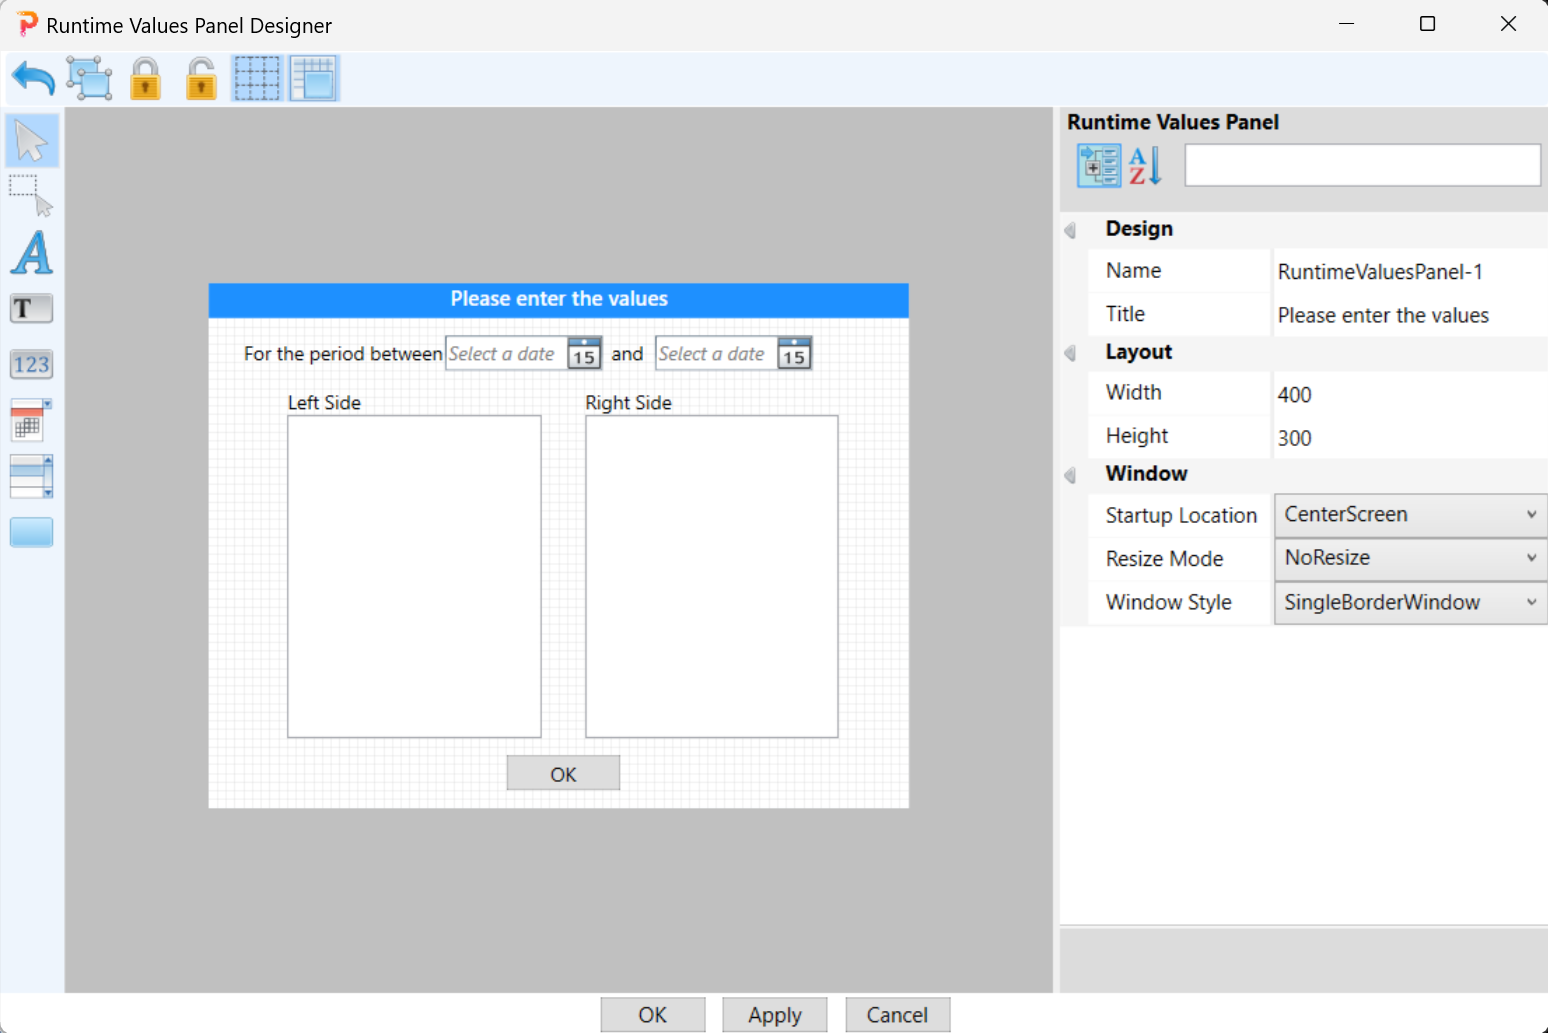
Click the Runtime Values Panel Designer button to open the Runtime Values Panel Designer.

Add Texts, Date Fields, List Boxes and a Button on the canvas as shown.
Click on the left List Box, set up the Database and click the Field Expression button and enter the expression as shown and click the Primary Key button.
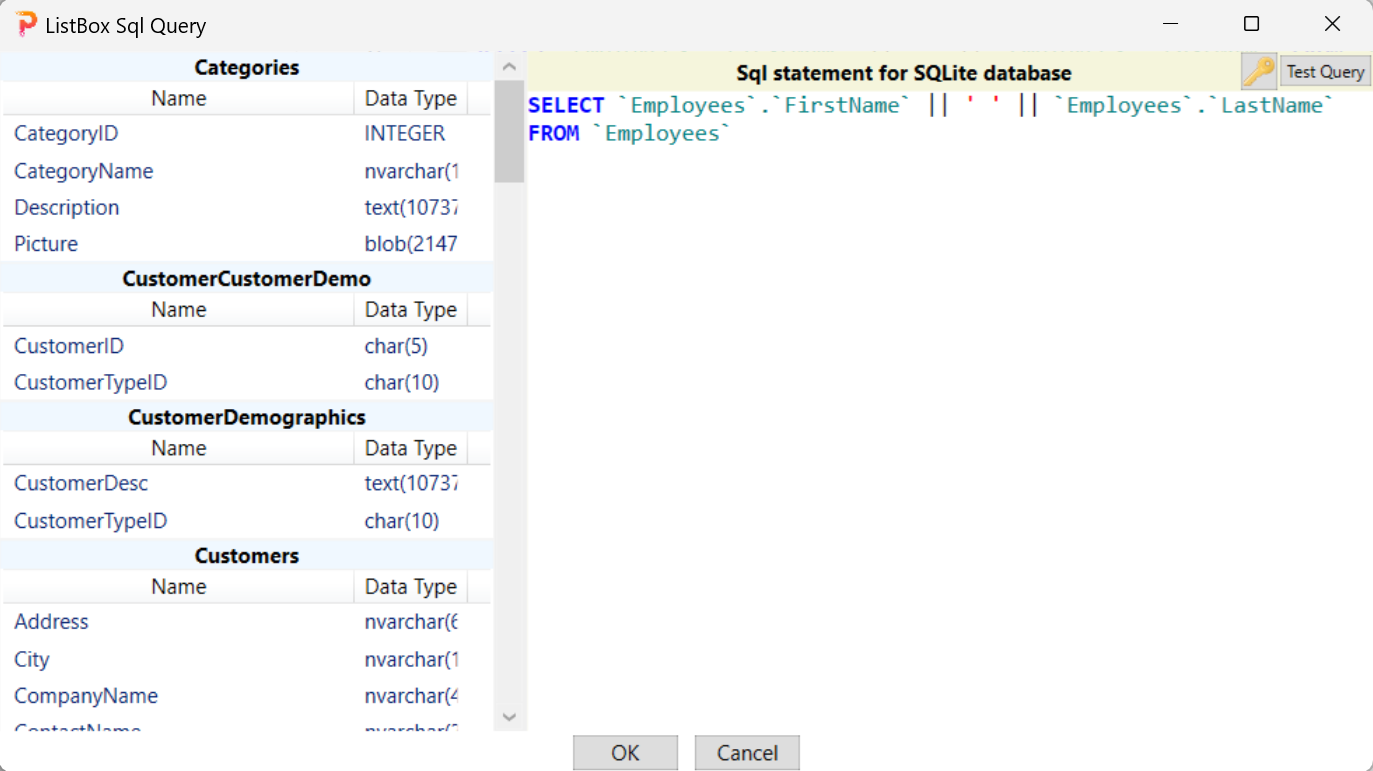
Repeat the same procedure for the right List Box. Go back to the designer.
Add a text under the title.
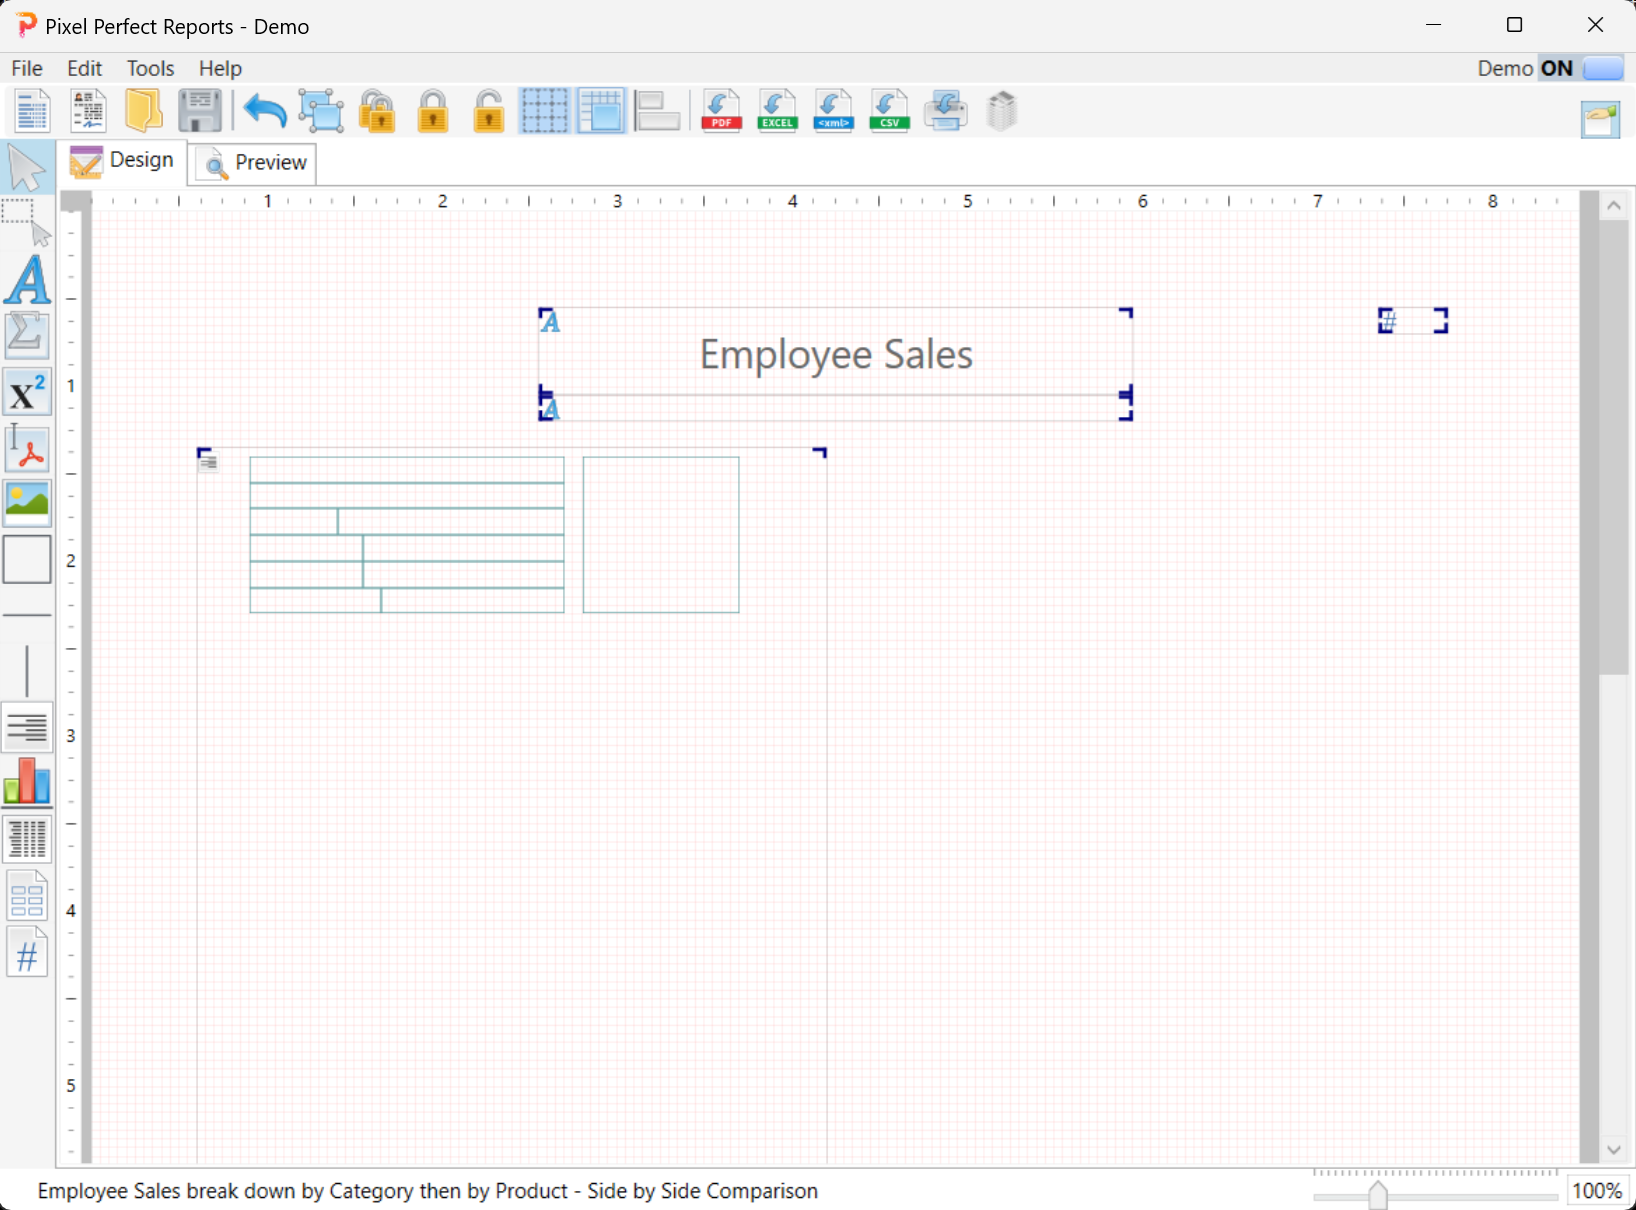
Double-click on the text and enter the expression as shown.
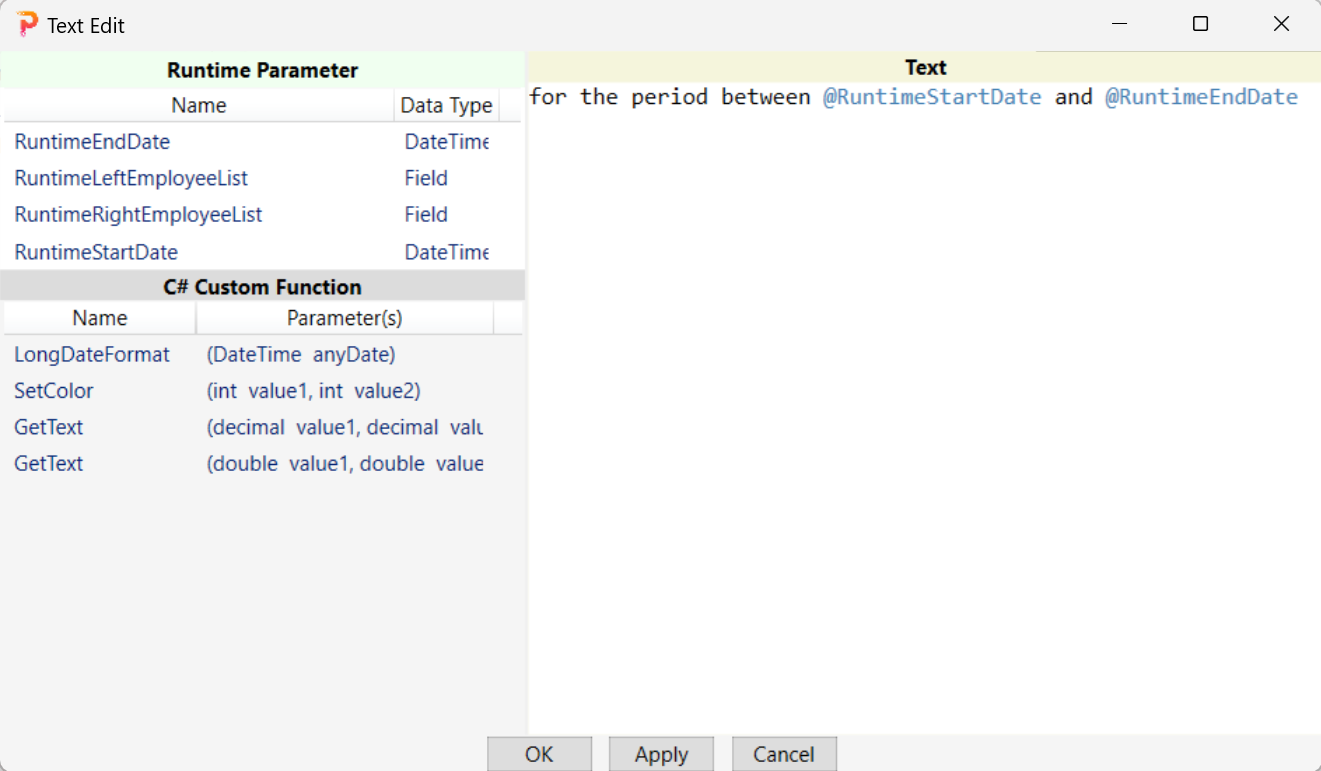
Go back to the List and add three texts and a list on the canvas as shown.

Double-click on the List and go to List Data Source Edit.
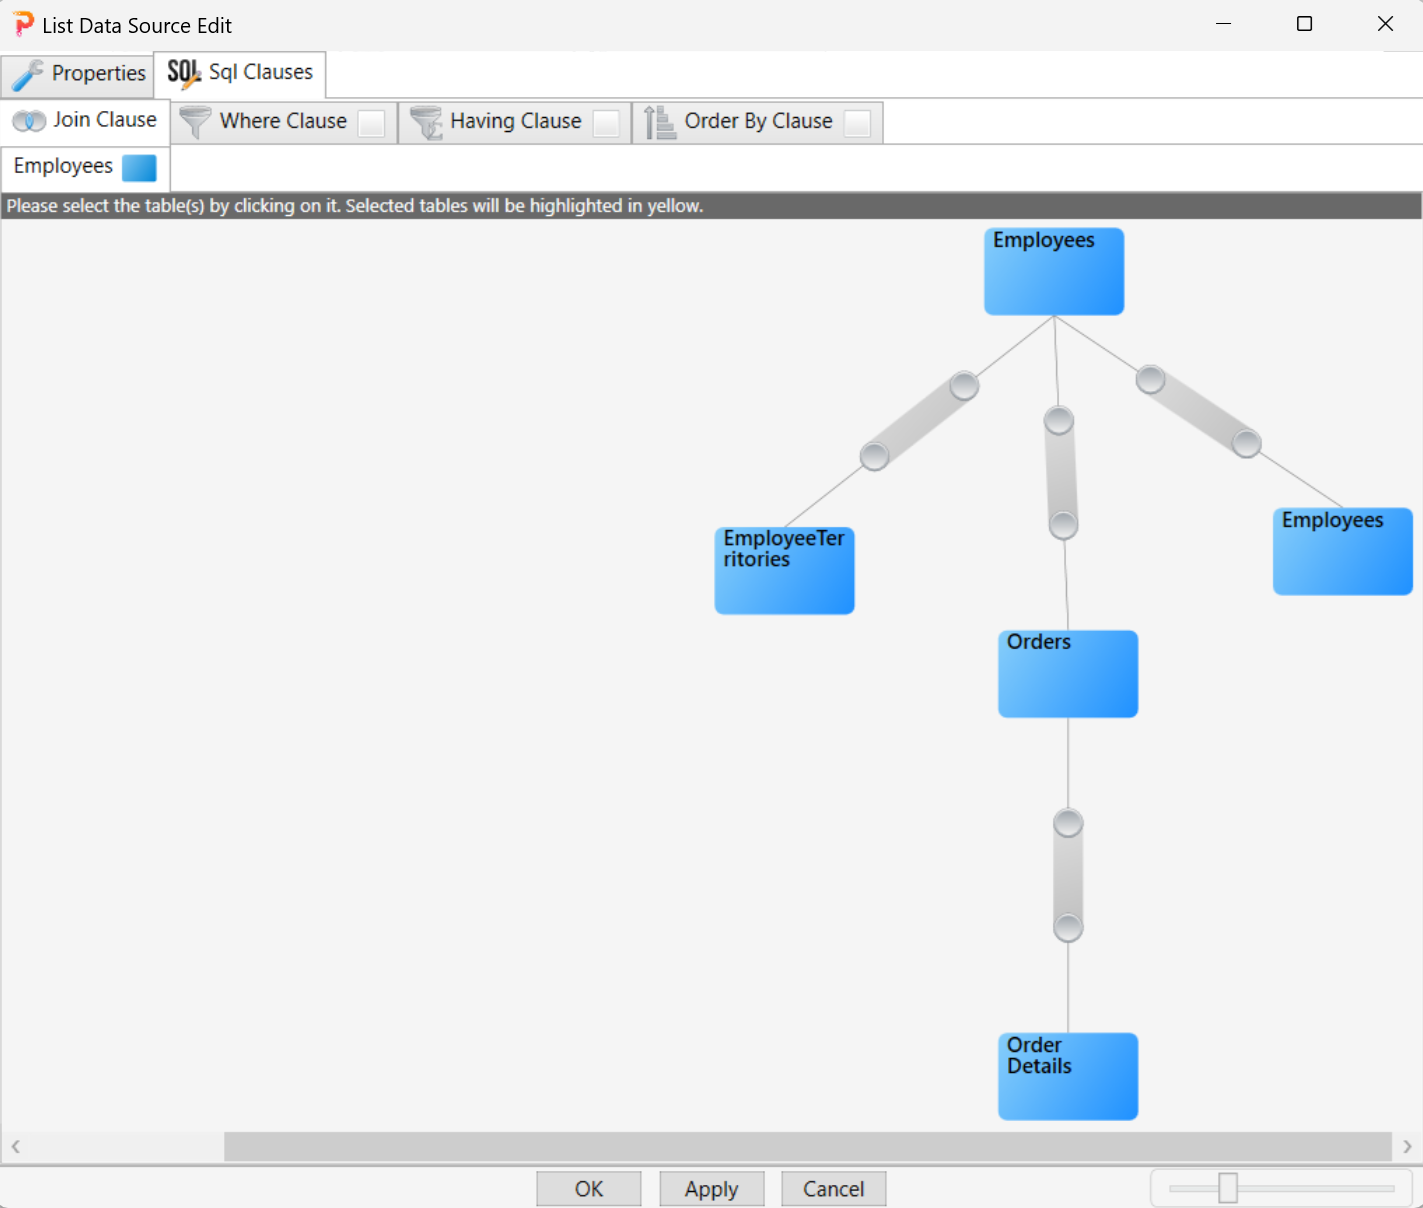
Select the 'Order Details' table by clicking on the 'Order Details' node.
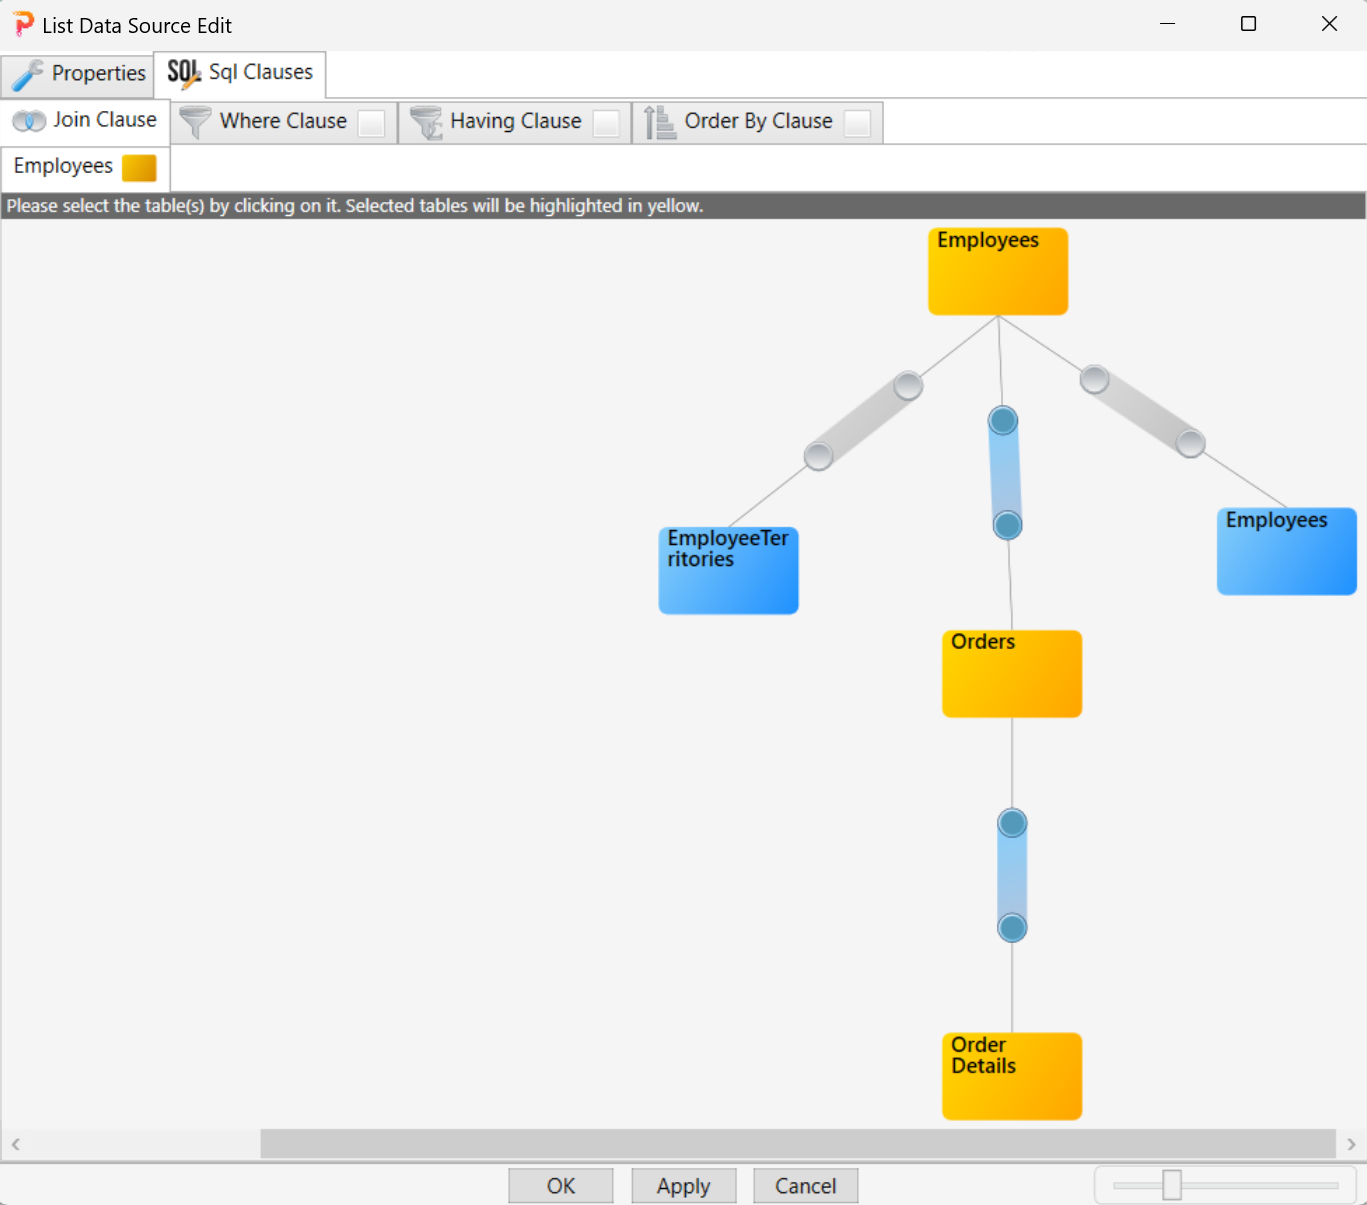
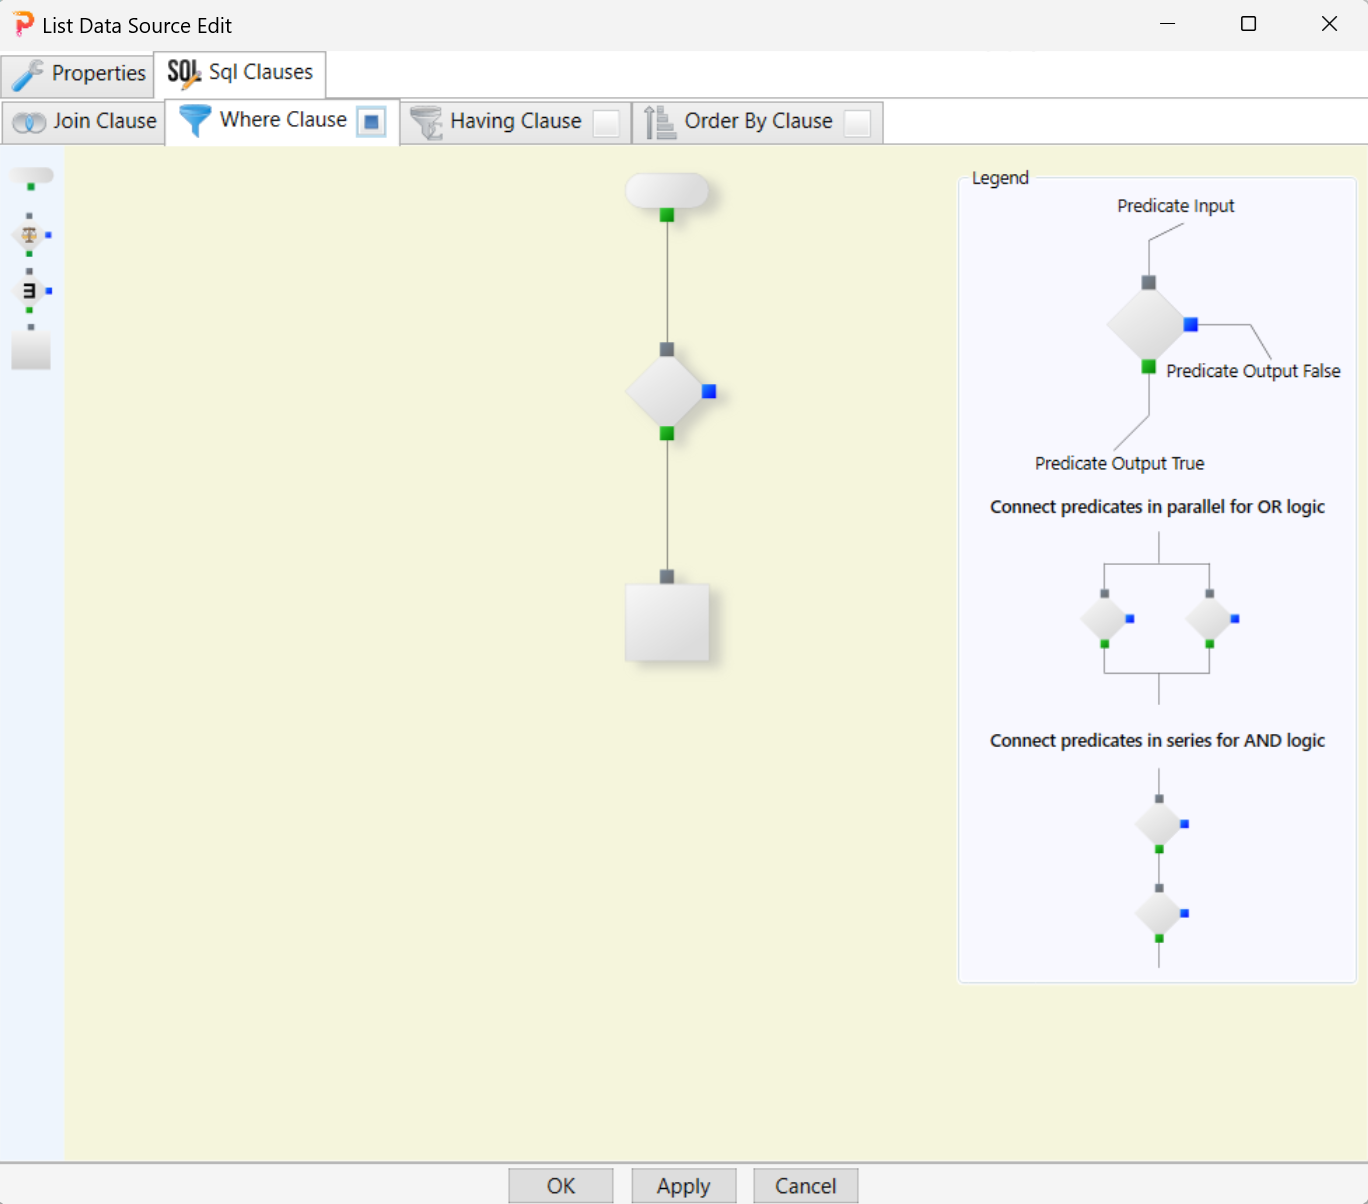
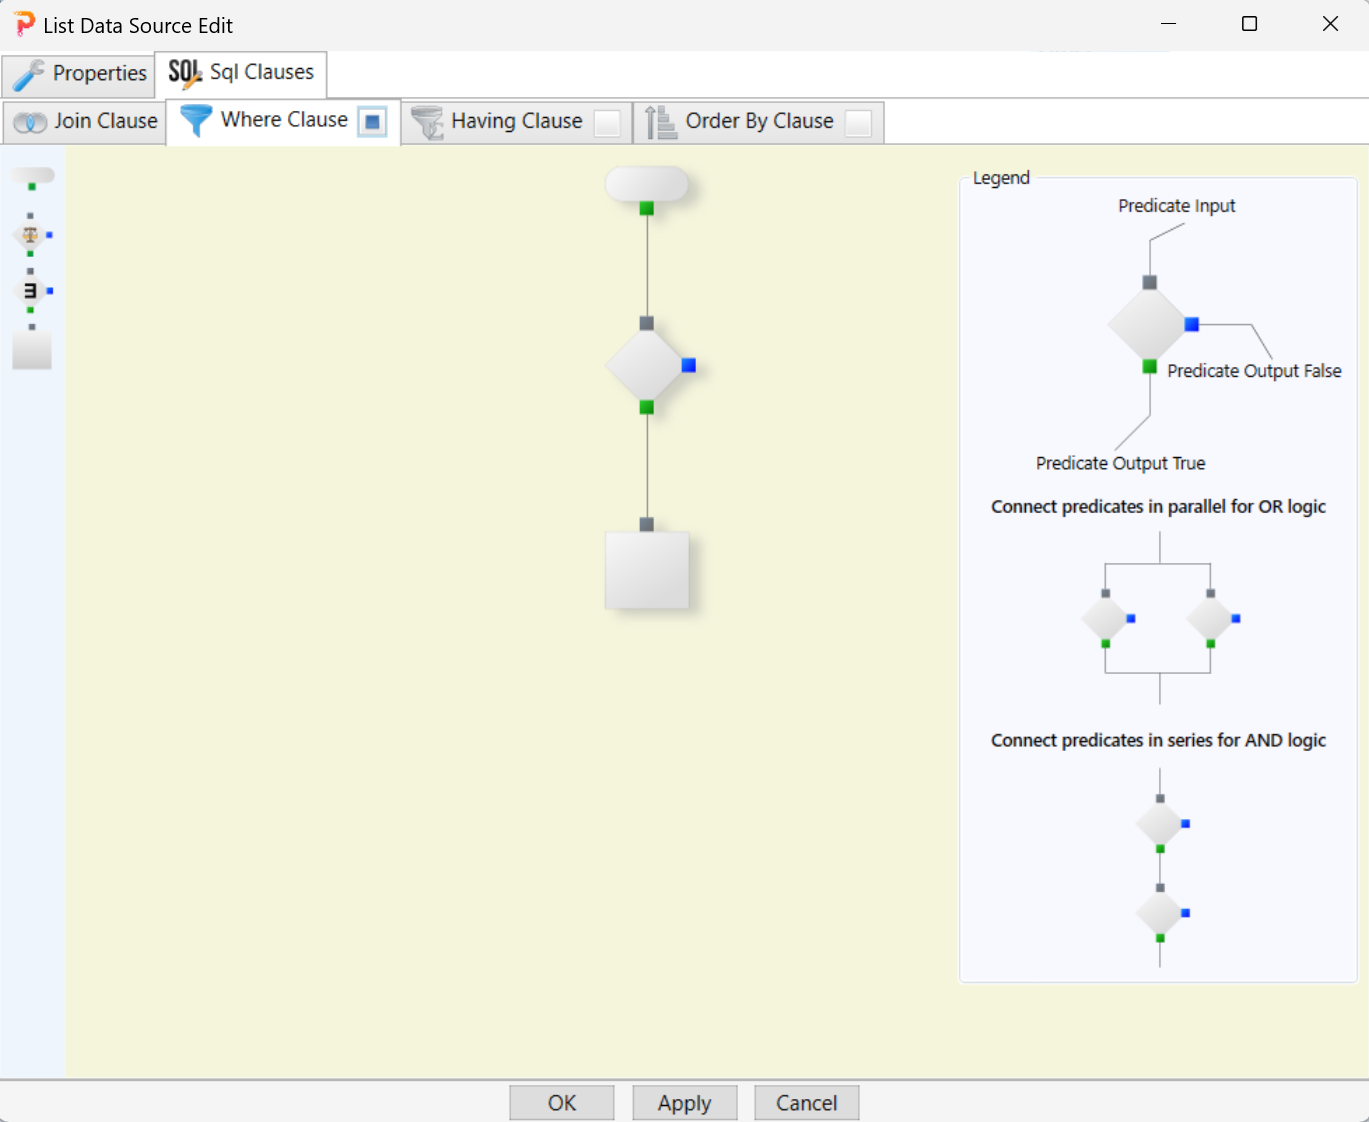
Go to the Where Clause tab and construct a flowchart as shown. Right now, there is no predicate in the predicate node. We will add the predicate in the predicate node later.
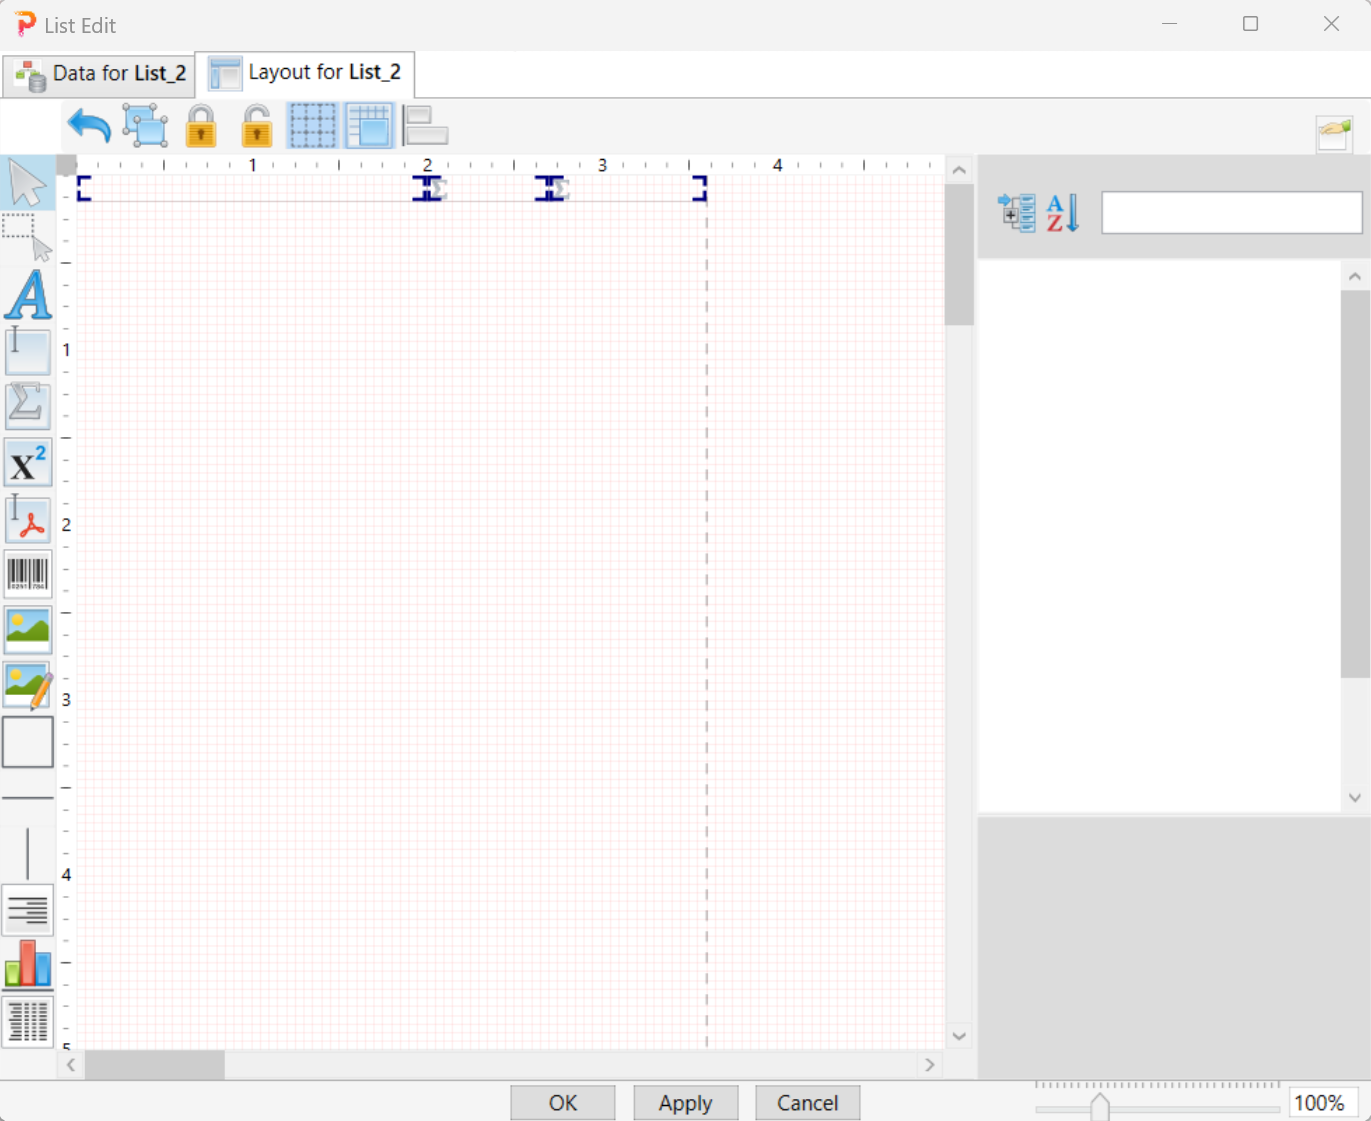
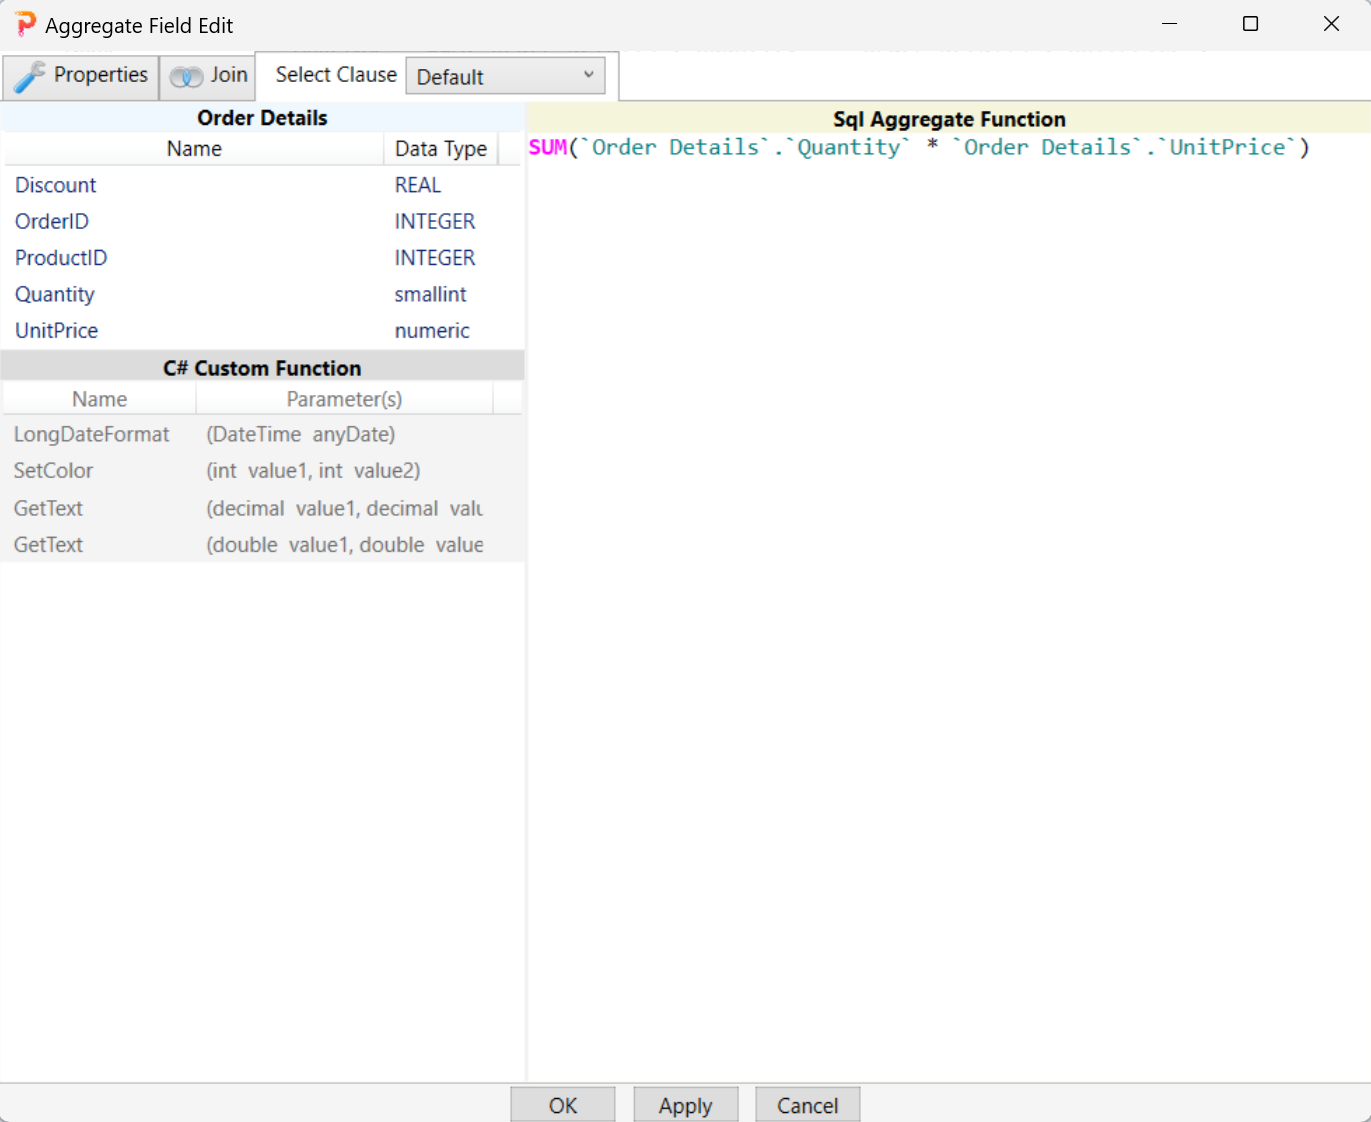
Click the OK button twice and go to the Layout tab of the list. Add one Text Field and two Aggregate Fields as shown.
Double-click the first Text Field and go to the Select Clause tab and enter the expression as shown.
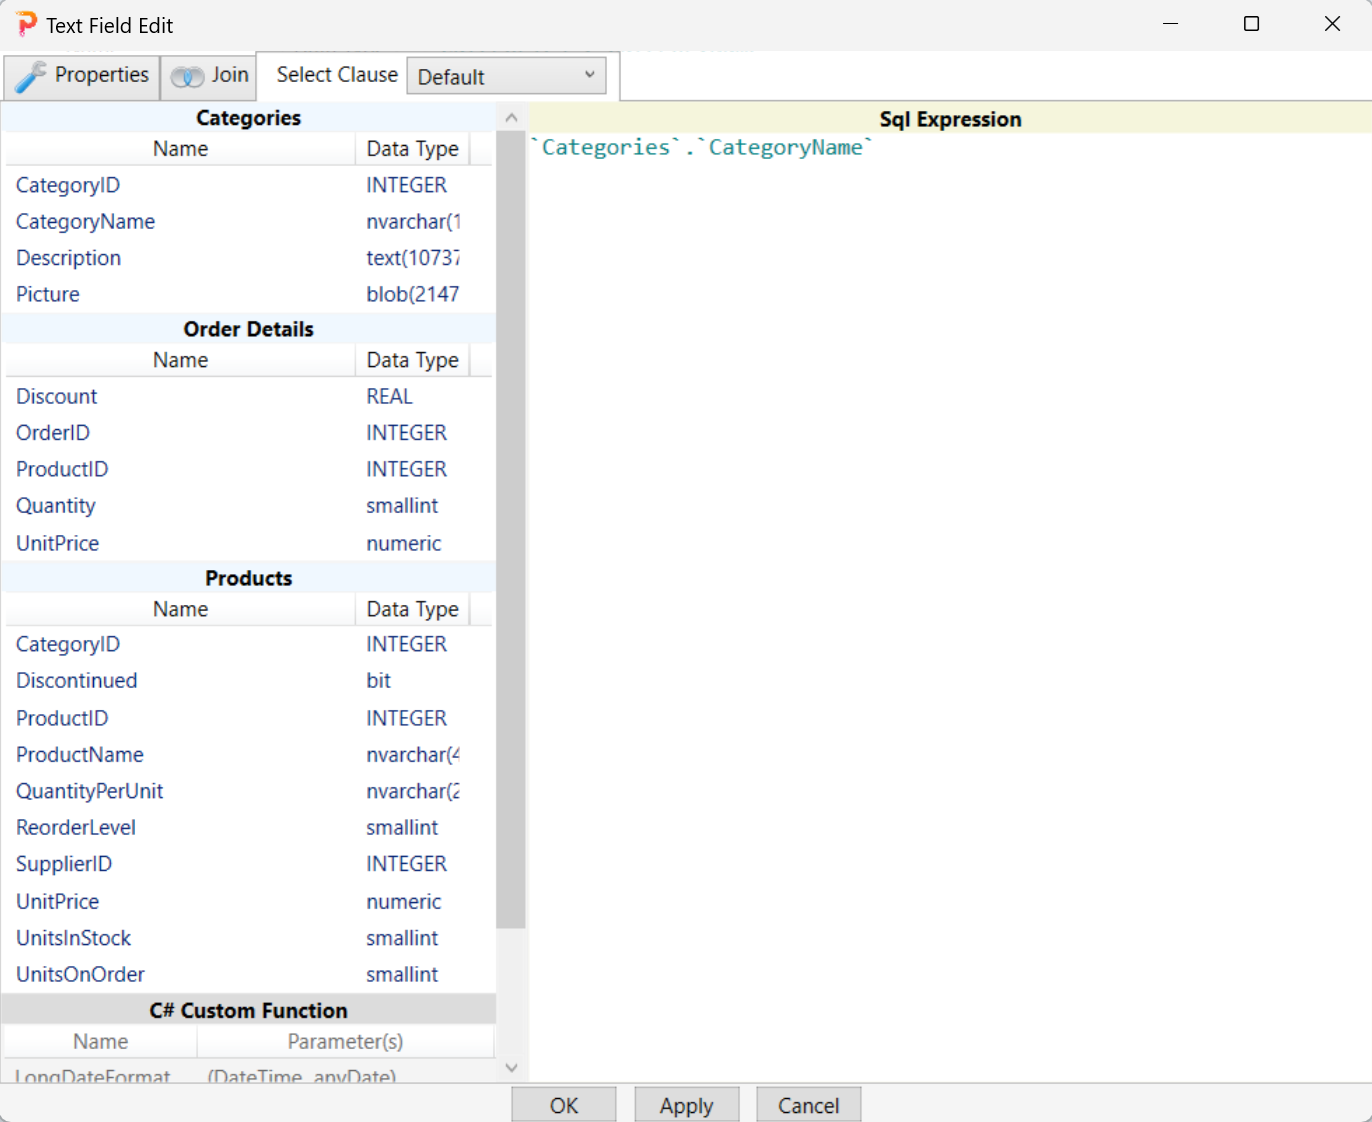
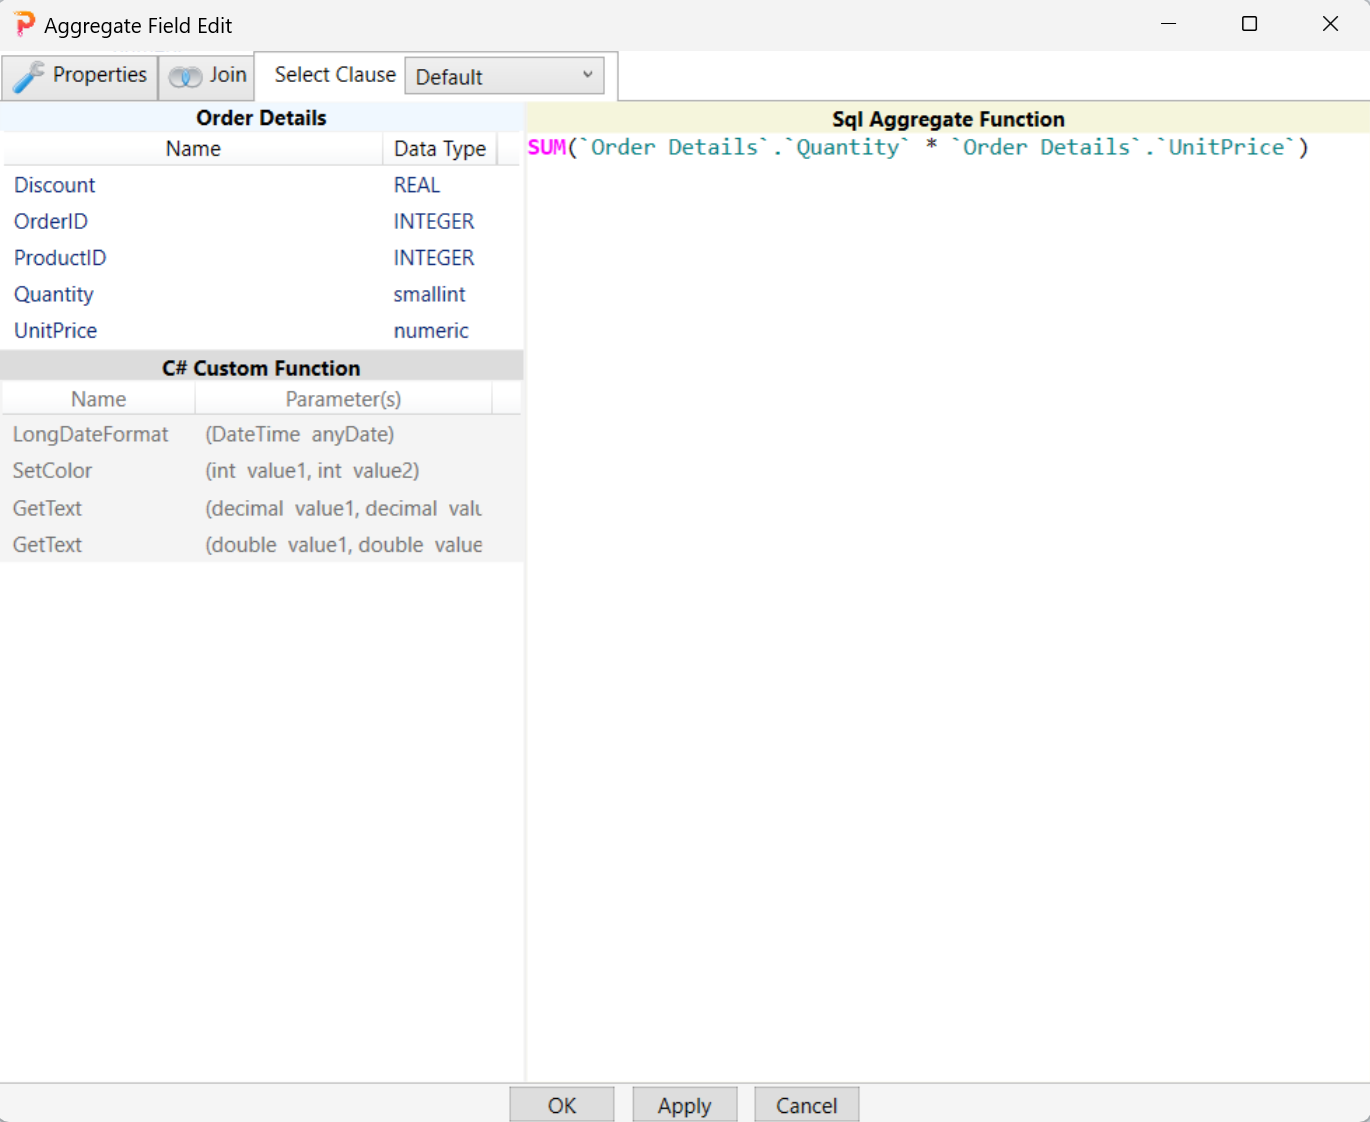
Repeat the same procedure on the second Aggregate Field and enter the expression as shown.
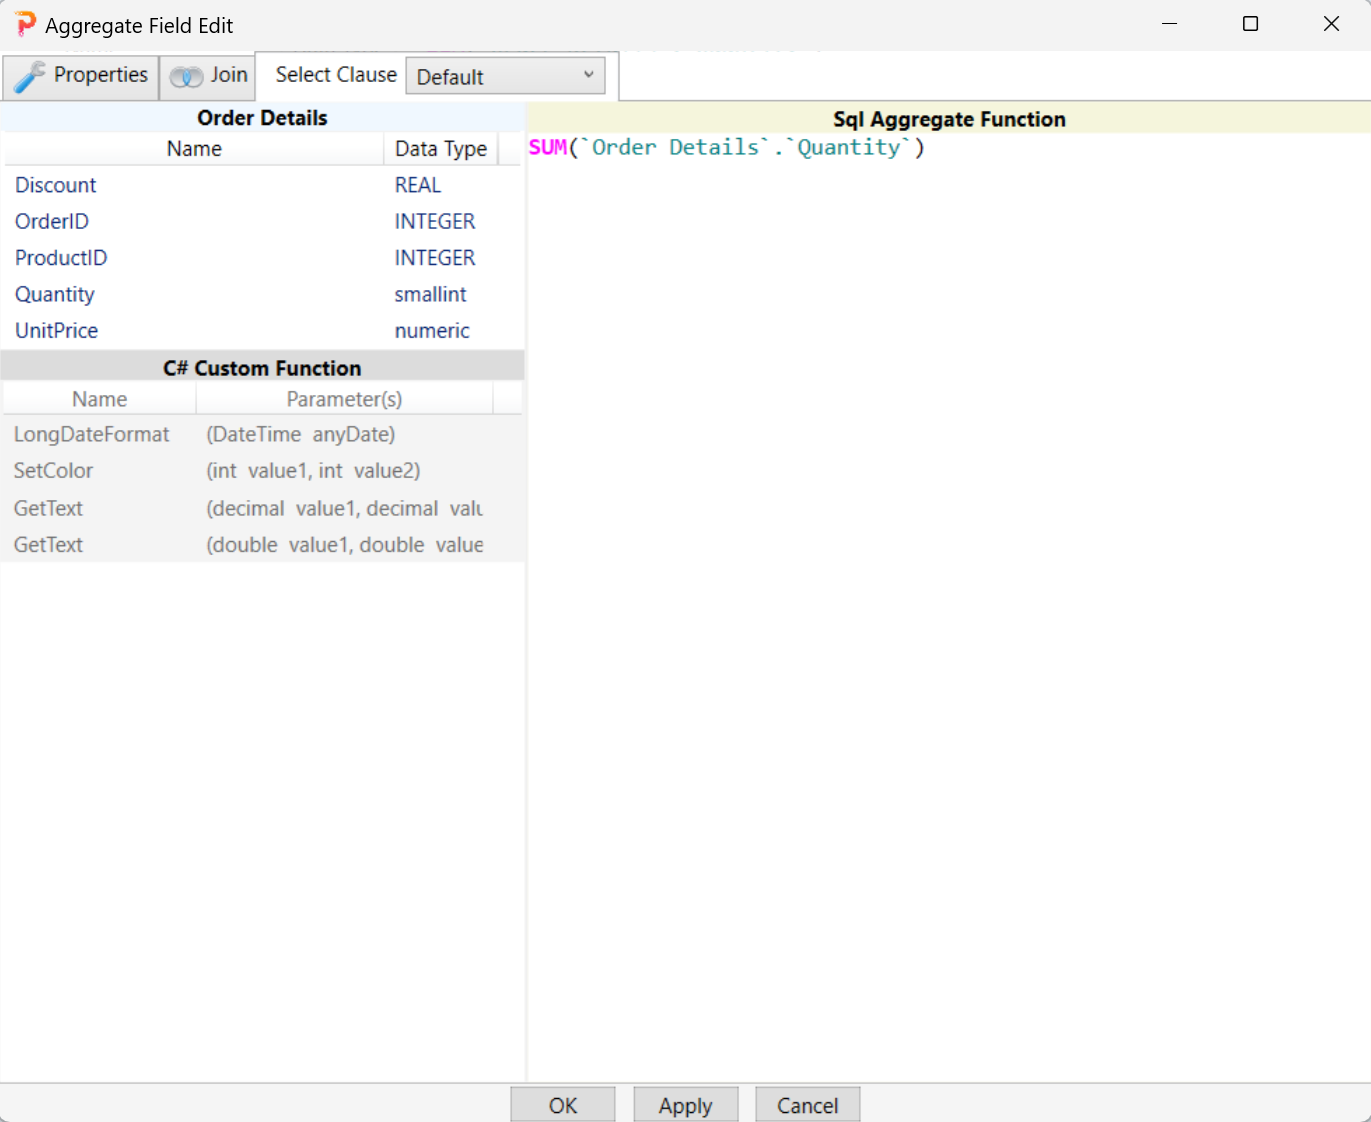
Repeat the same procedure on the third Aggregate Field and enter the expression as shown.
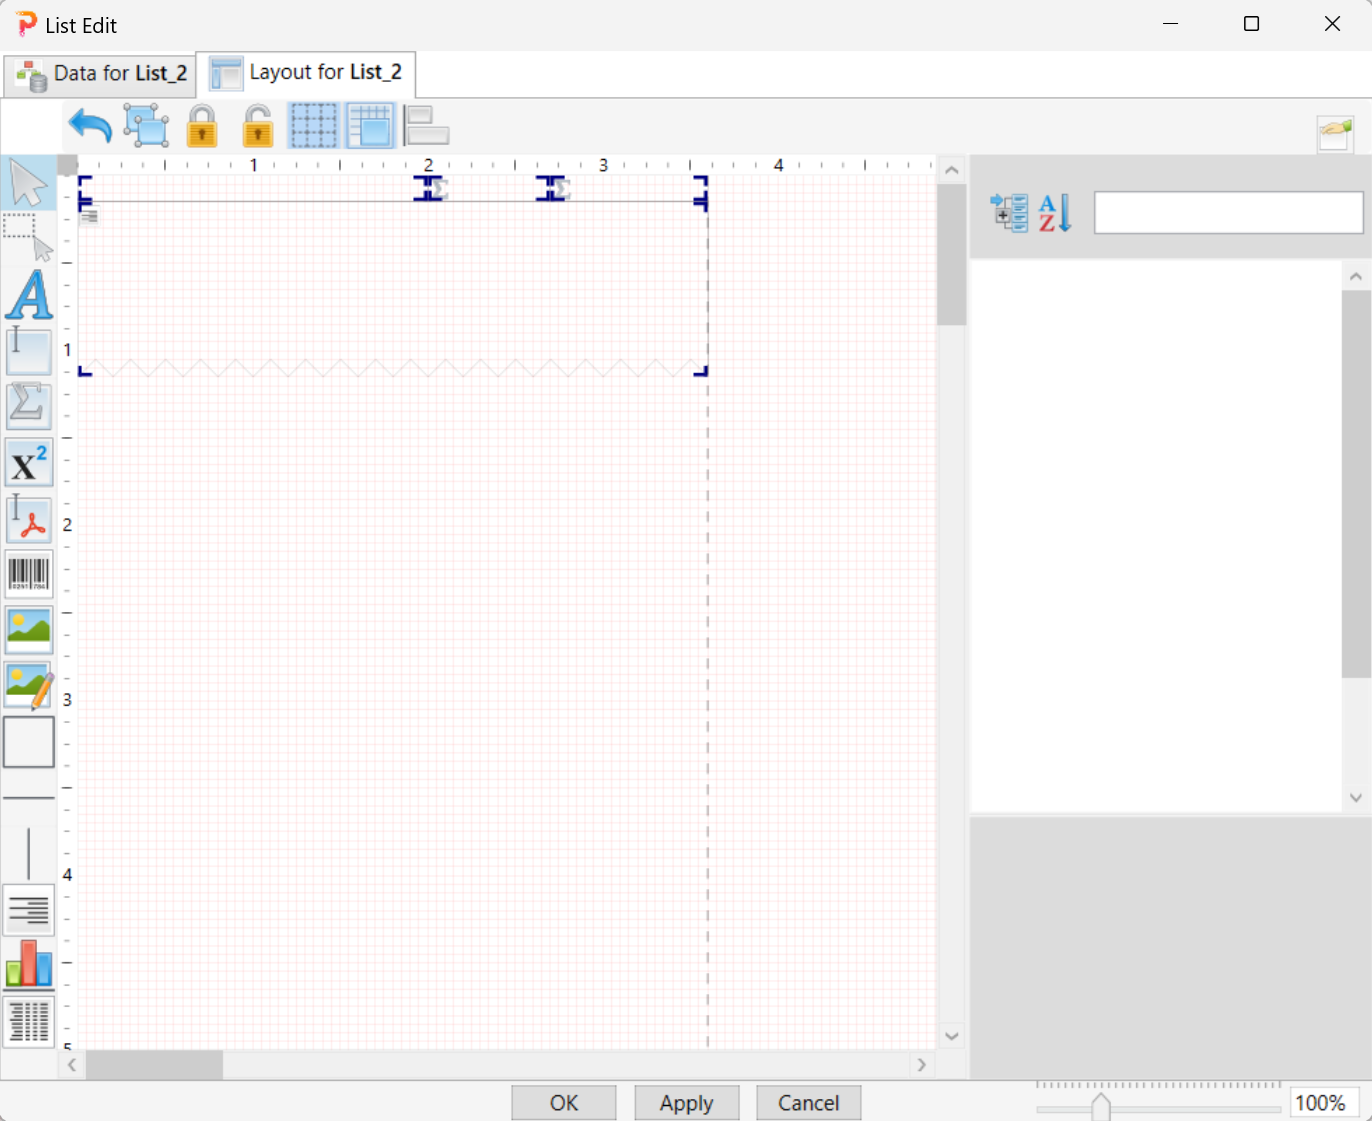
Double-click the OK button twice to go back to the Layout tab of the second level List and add a List underneath the three fields as shown.
Double-click the List, then go to the List Data Source Edit.
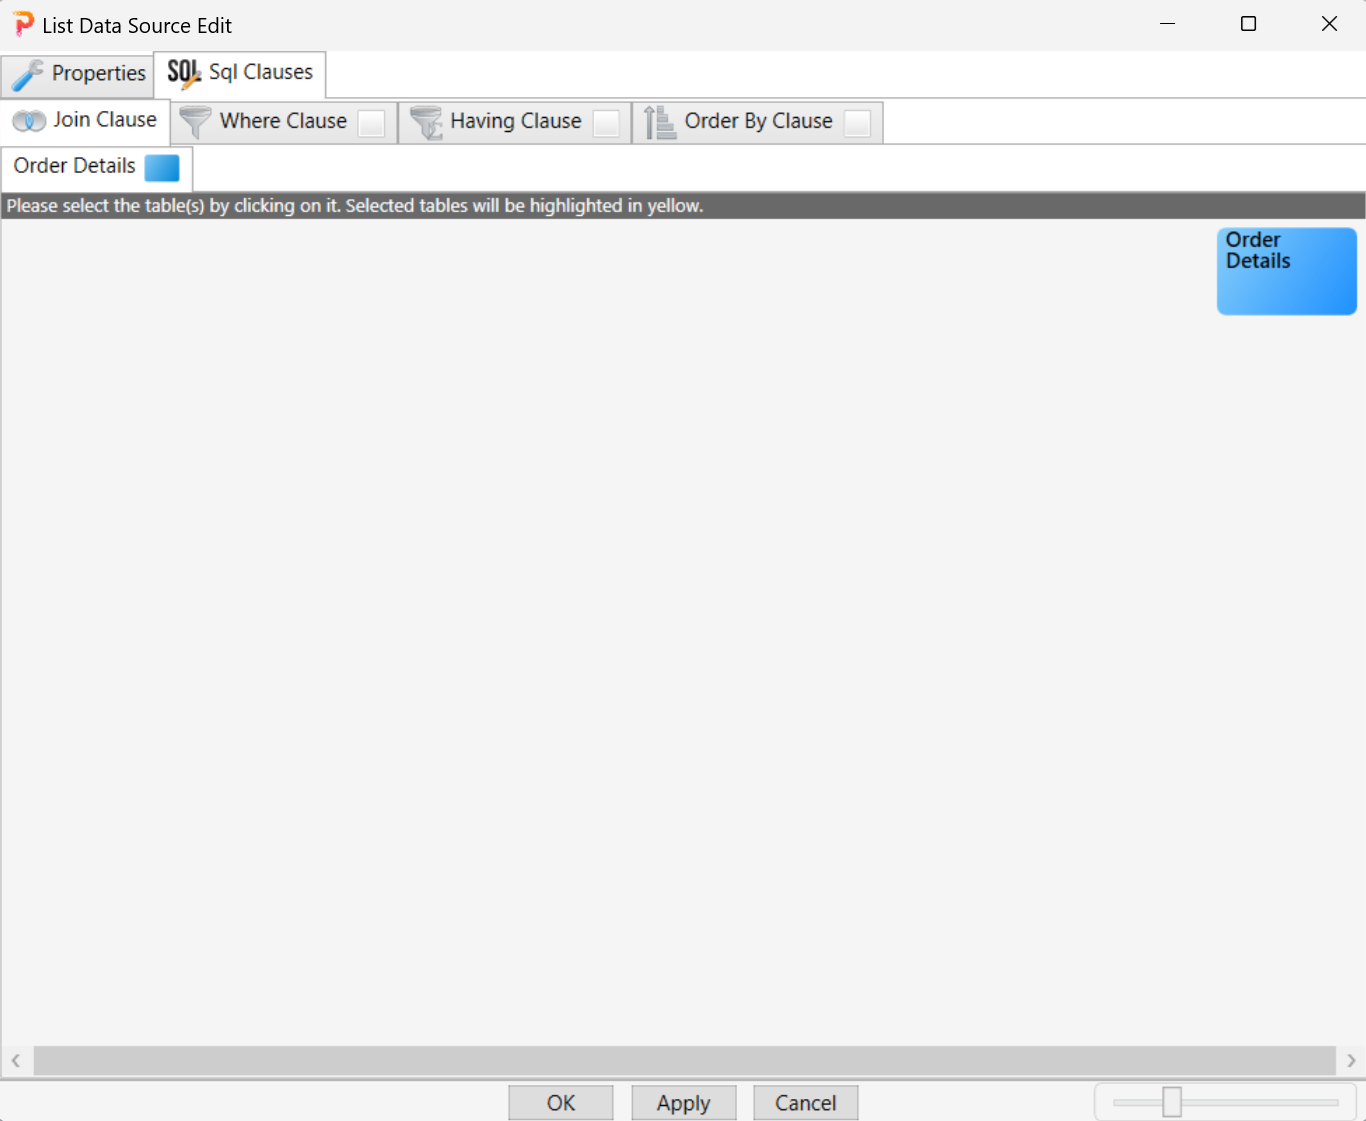
Select the 'Order Details' table by clicking on the 'Order Details' node.
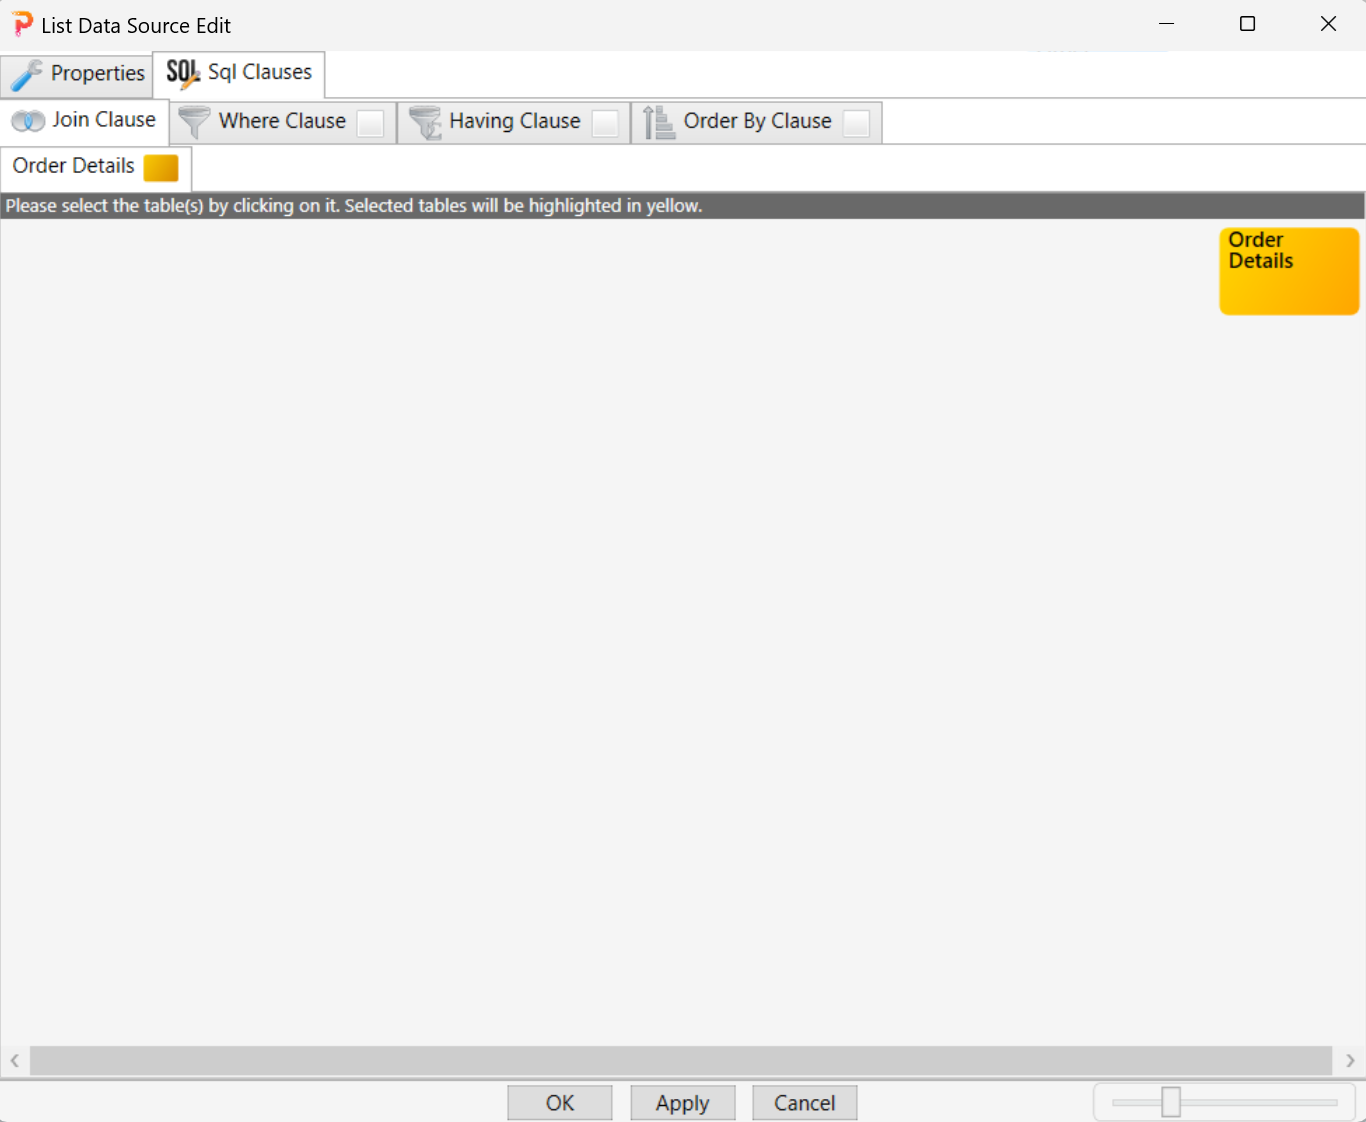
Go to the Where Clause tab and construct a flowchart as shown. Right now, there is no predicate in the predicate node. We will add the predicate in the predicate node later.
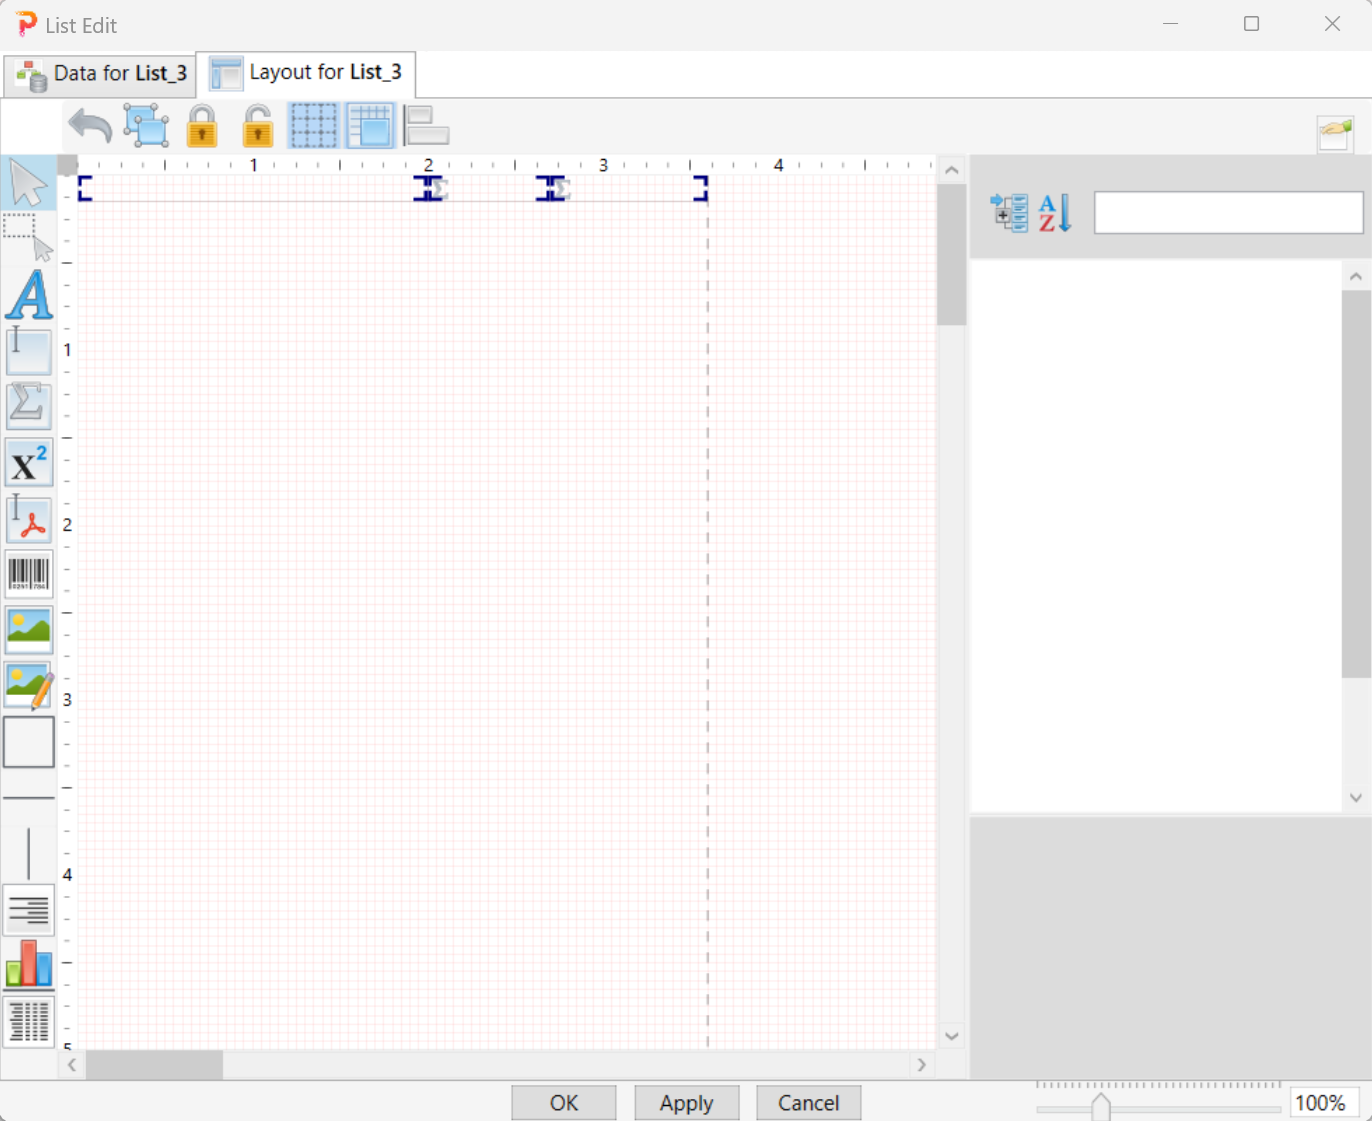
Click the OK button twice and go to the Layout tab of the list. Add one Text Field and two Aggregate Fields as shown.
Double-click the first Text Field and go to the Select Clause tab and enter the expression as shown.
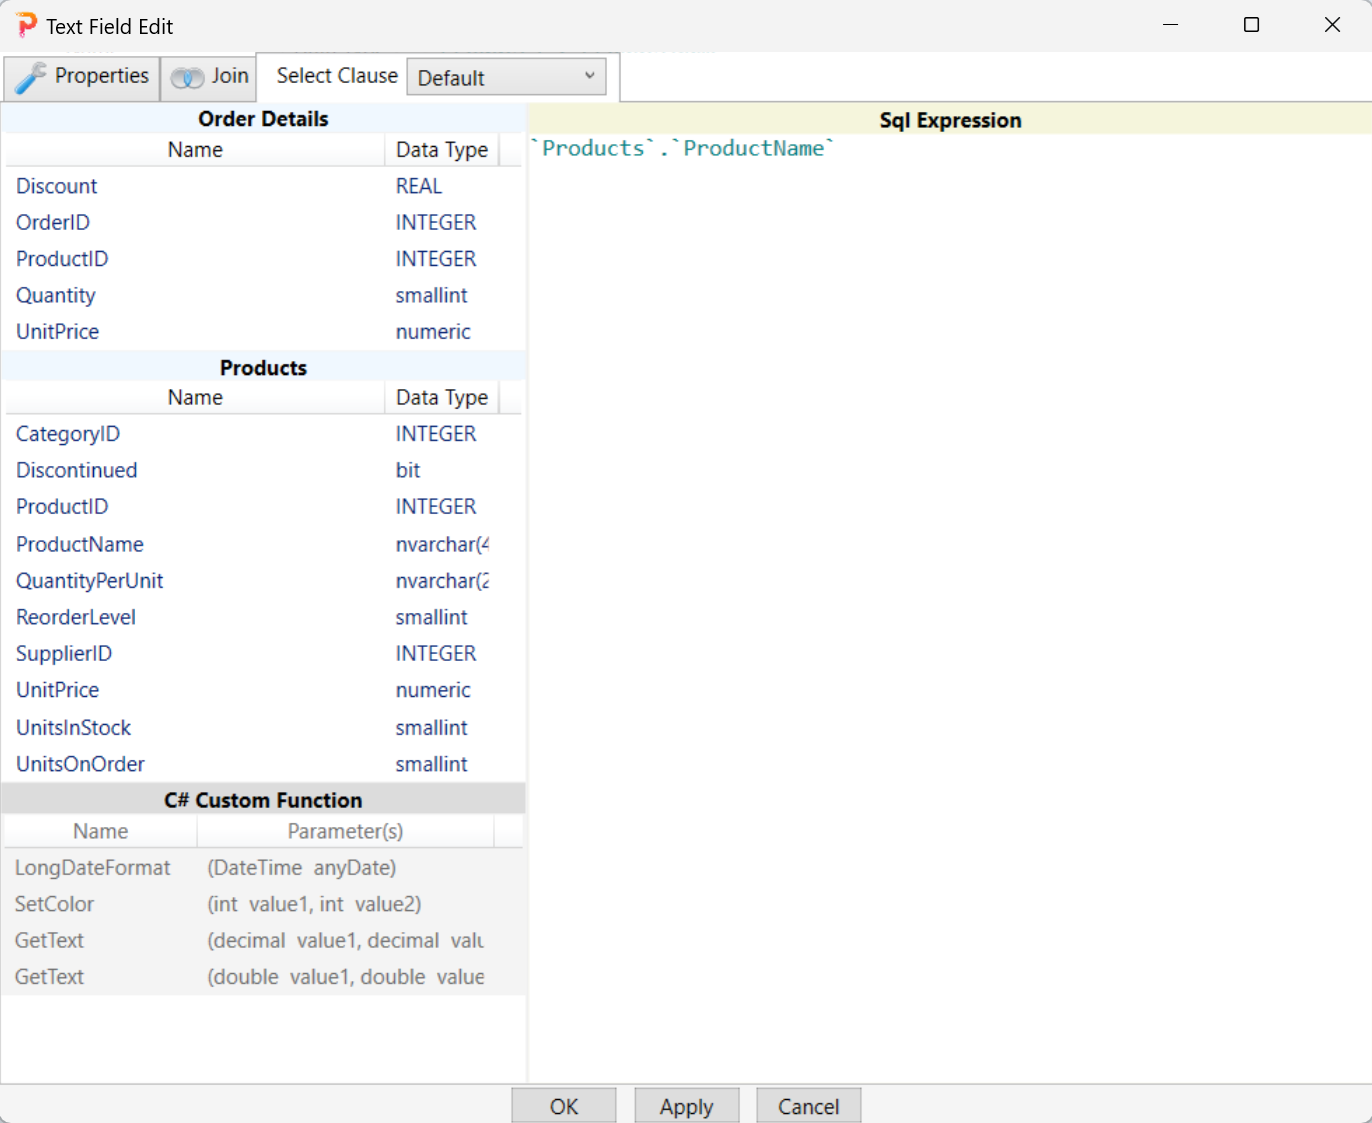
Repeat the same procedure on the second Aggregate Field and enter the expression as shown.

Repeat the same procedure on the third Aggregate Field and enter the expression as shown.
Filter the left list in the first level to the employee selected by the user at runtime
Go to the List Data Source Edit of the first list and go to the Where clause tab.

In the Join tab, select the 'Employees' table by clicking on the 'Employees' node.

Go to the Expression tab and enter the expression as shown.
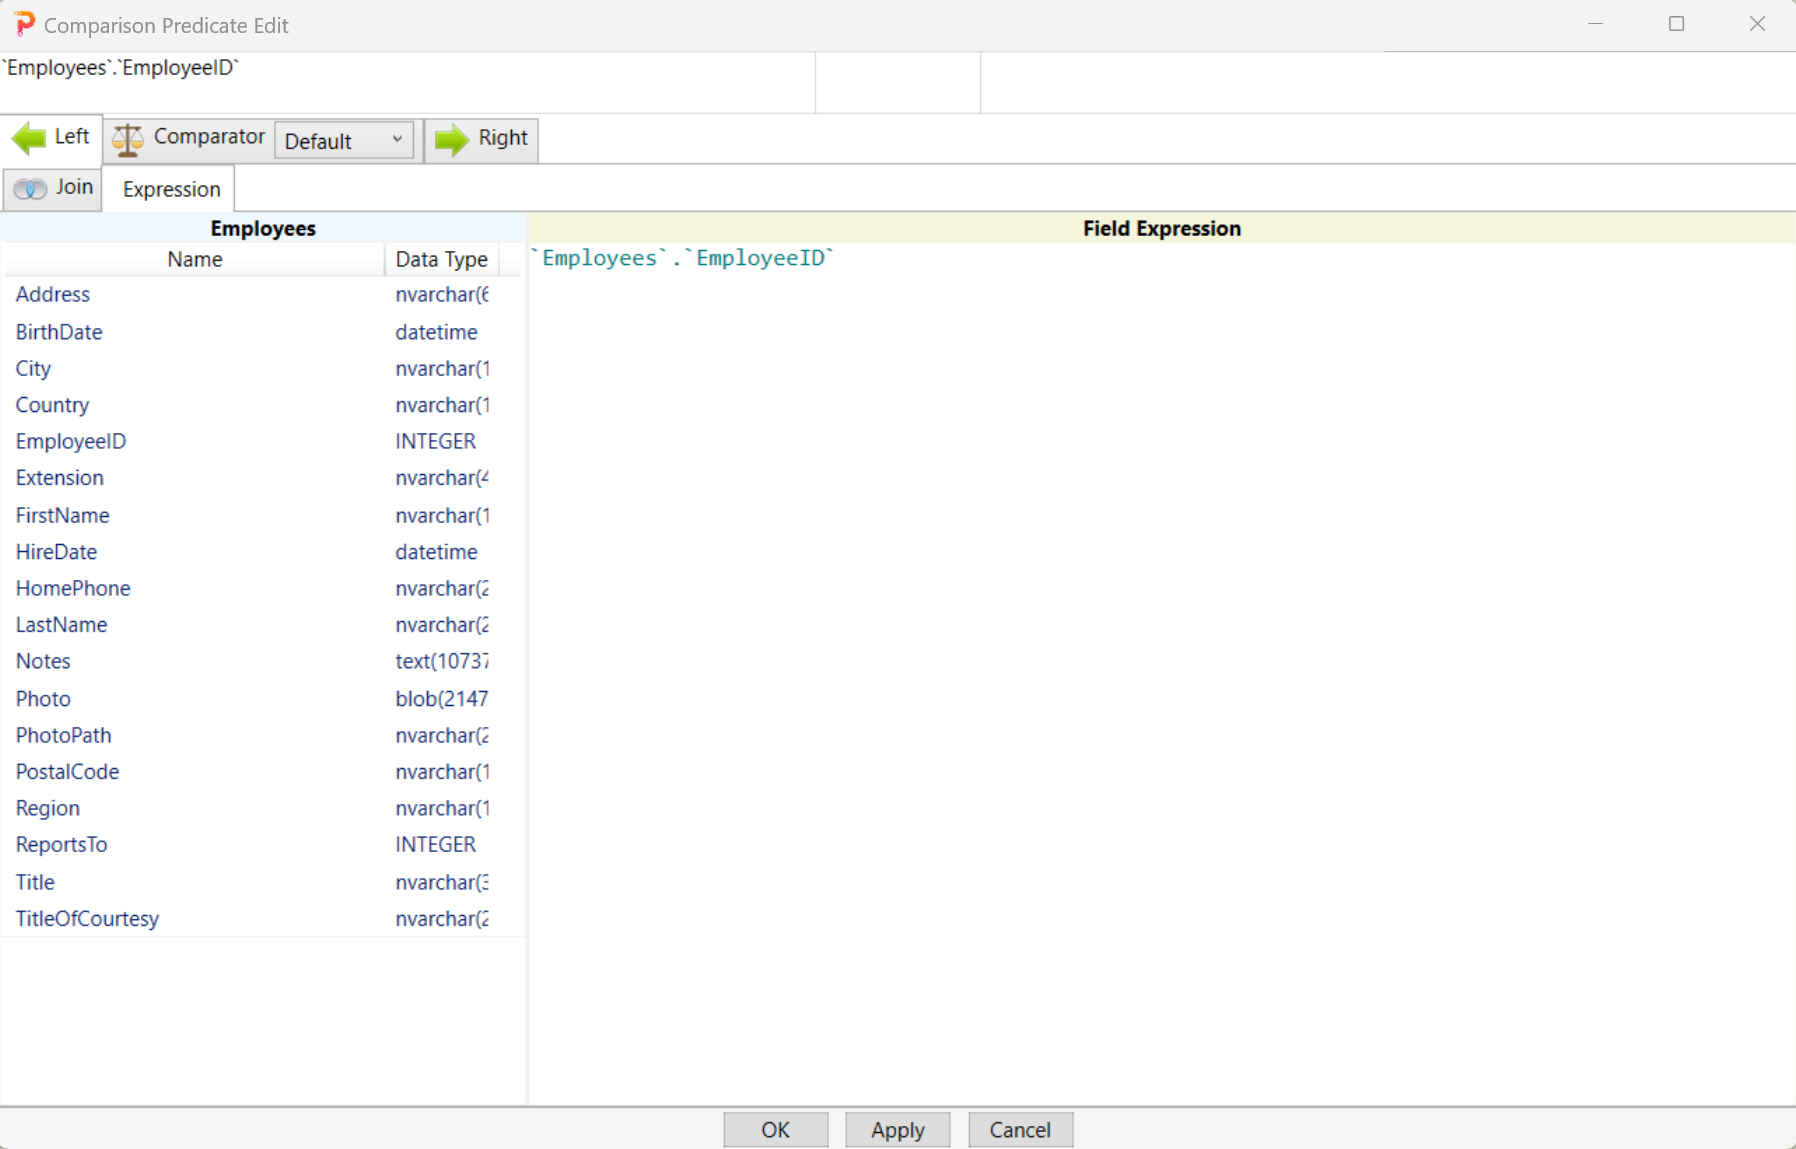
Go to the Comparator tab and enter the comparator as shown.
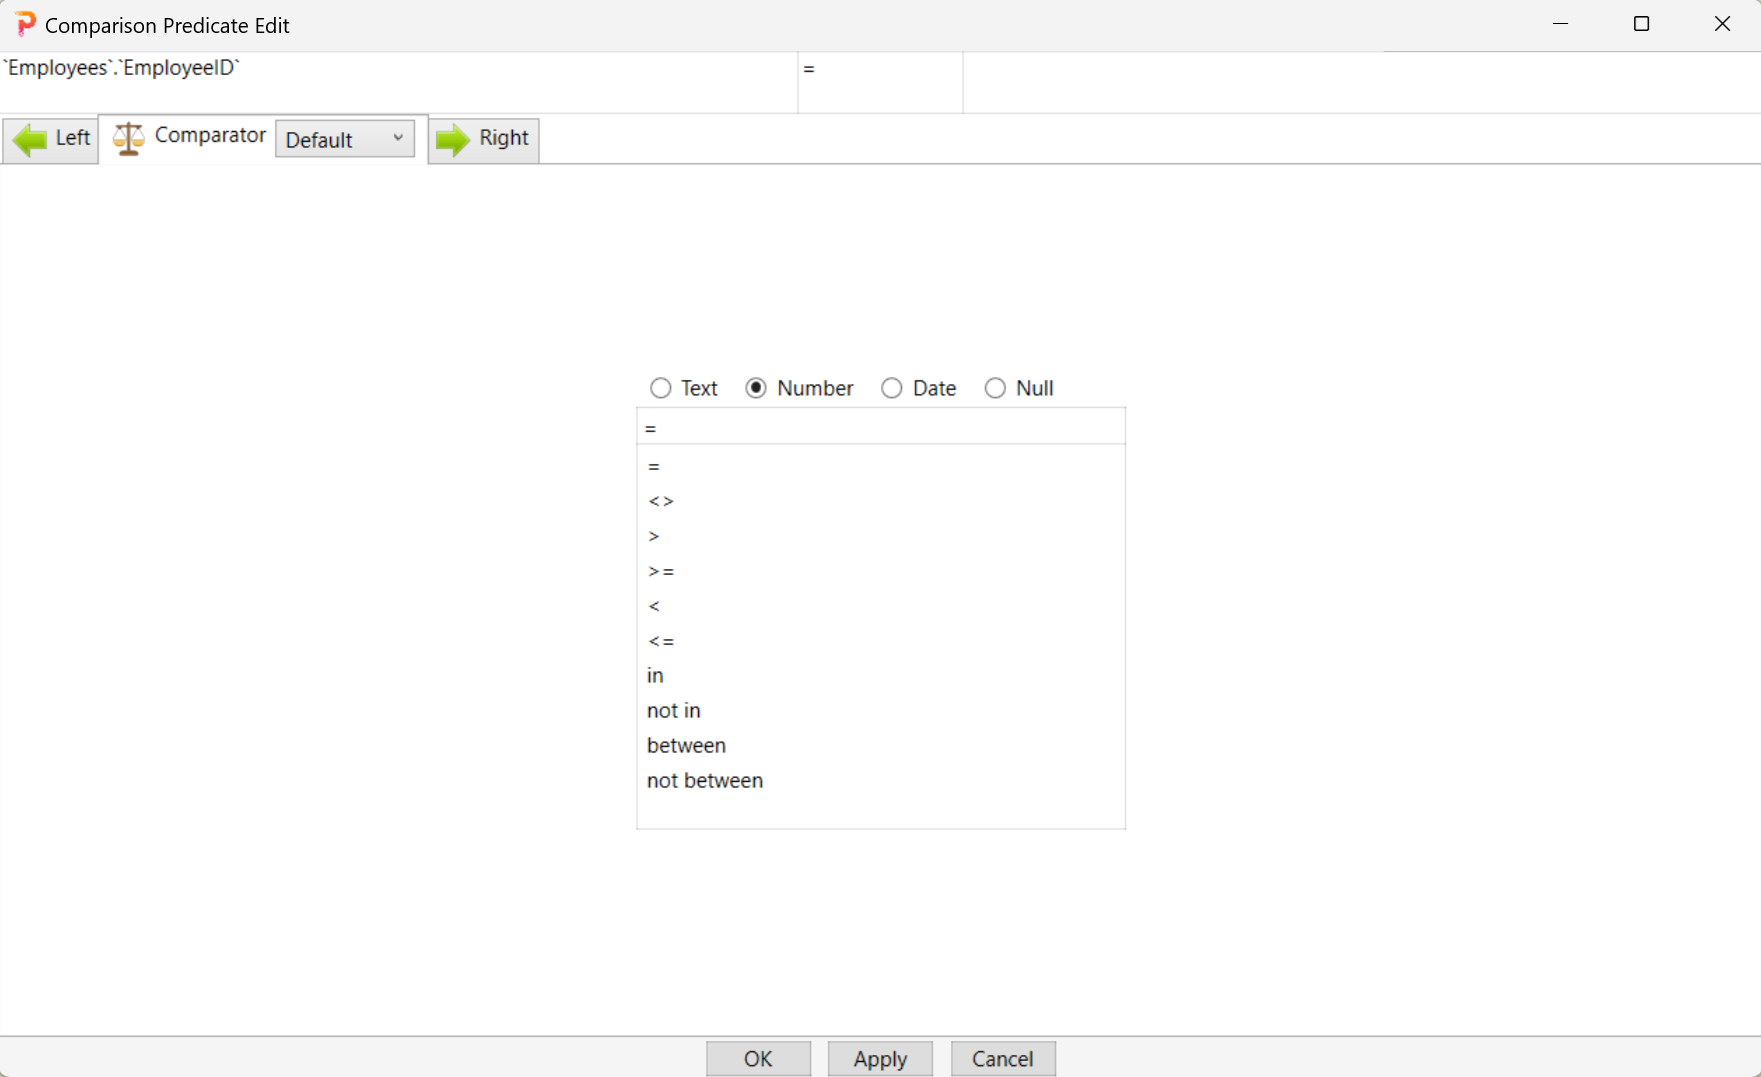
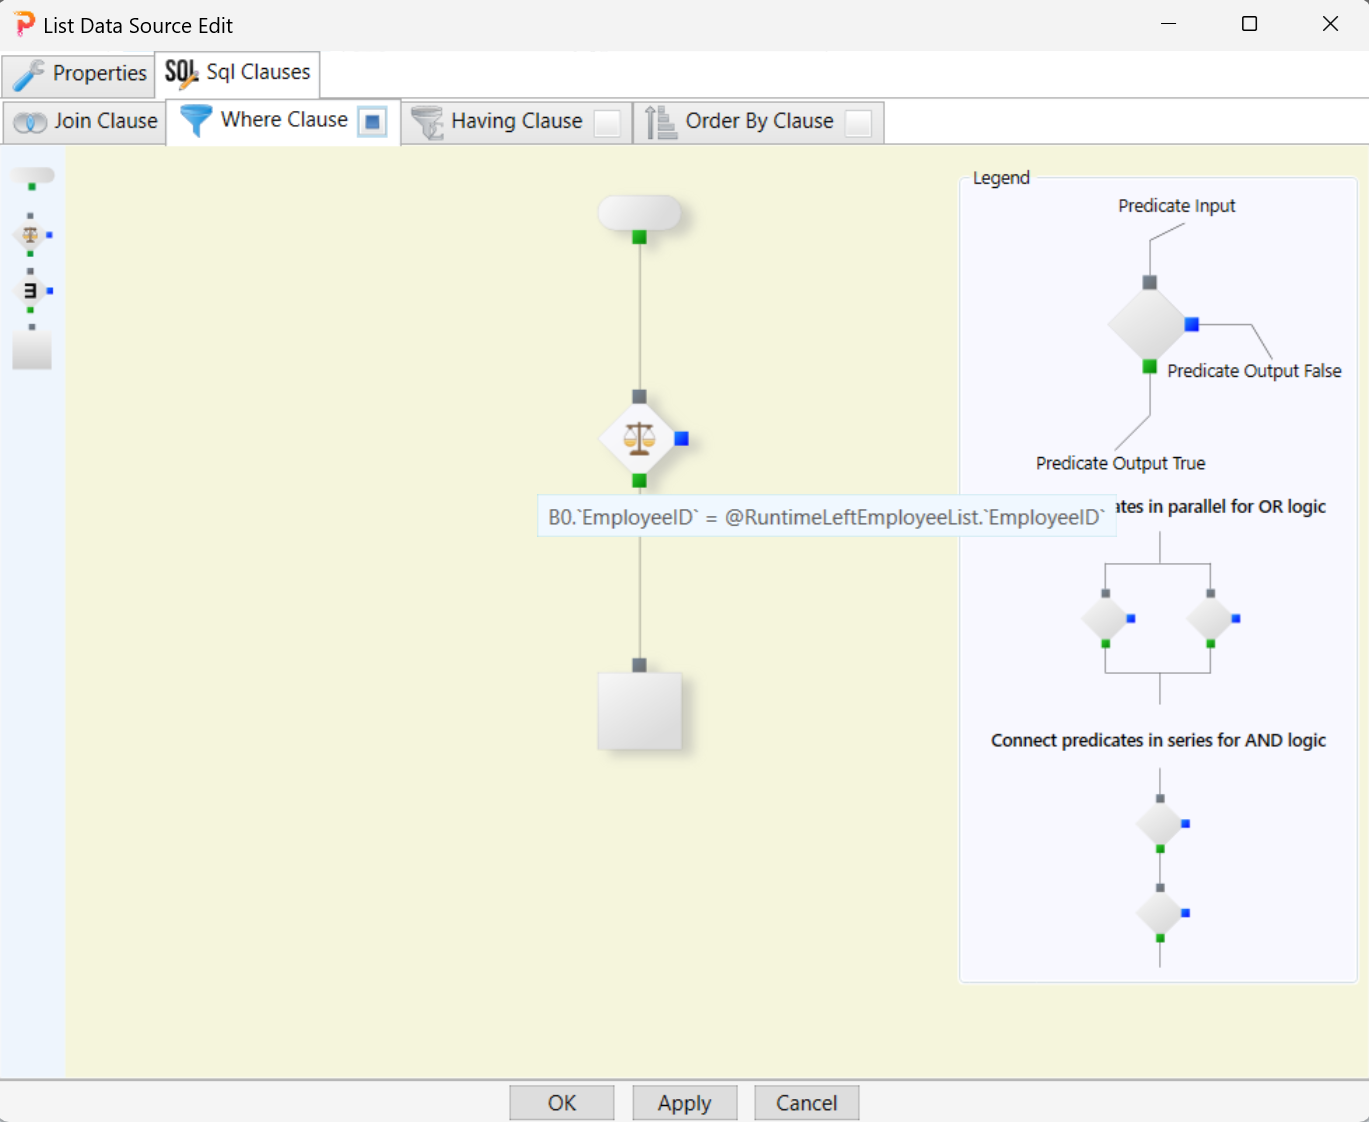
Go to the Right tab, then go to the Expression tab and double-click on the @RuntimeLeftEmployeeList.`EmployeeID` entry in the left pane to enter the expression in the right pane.
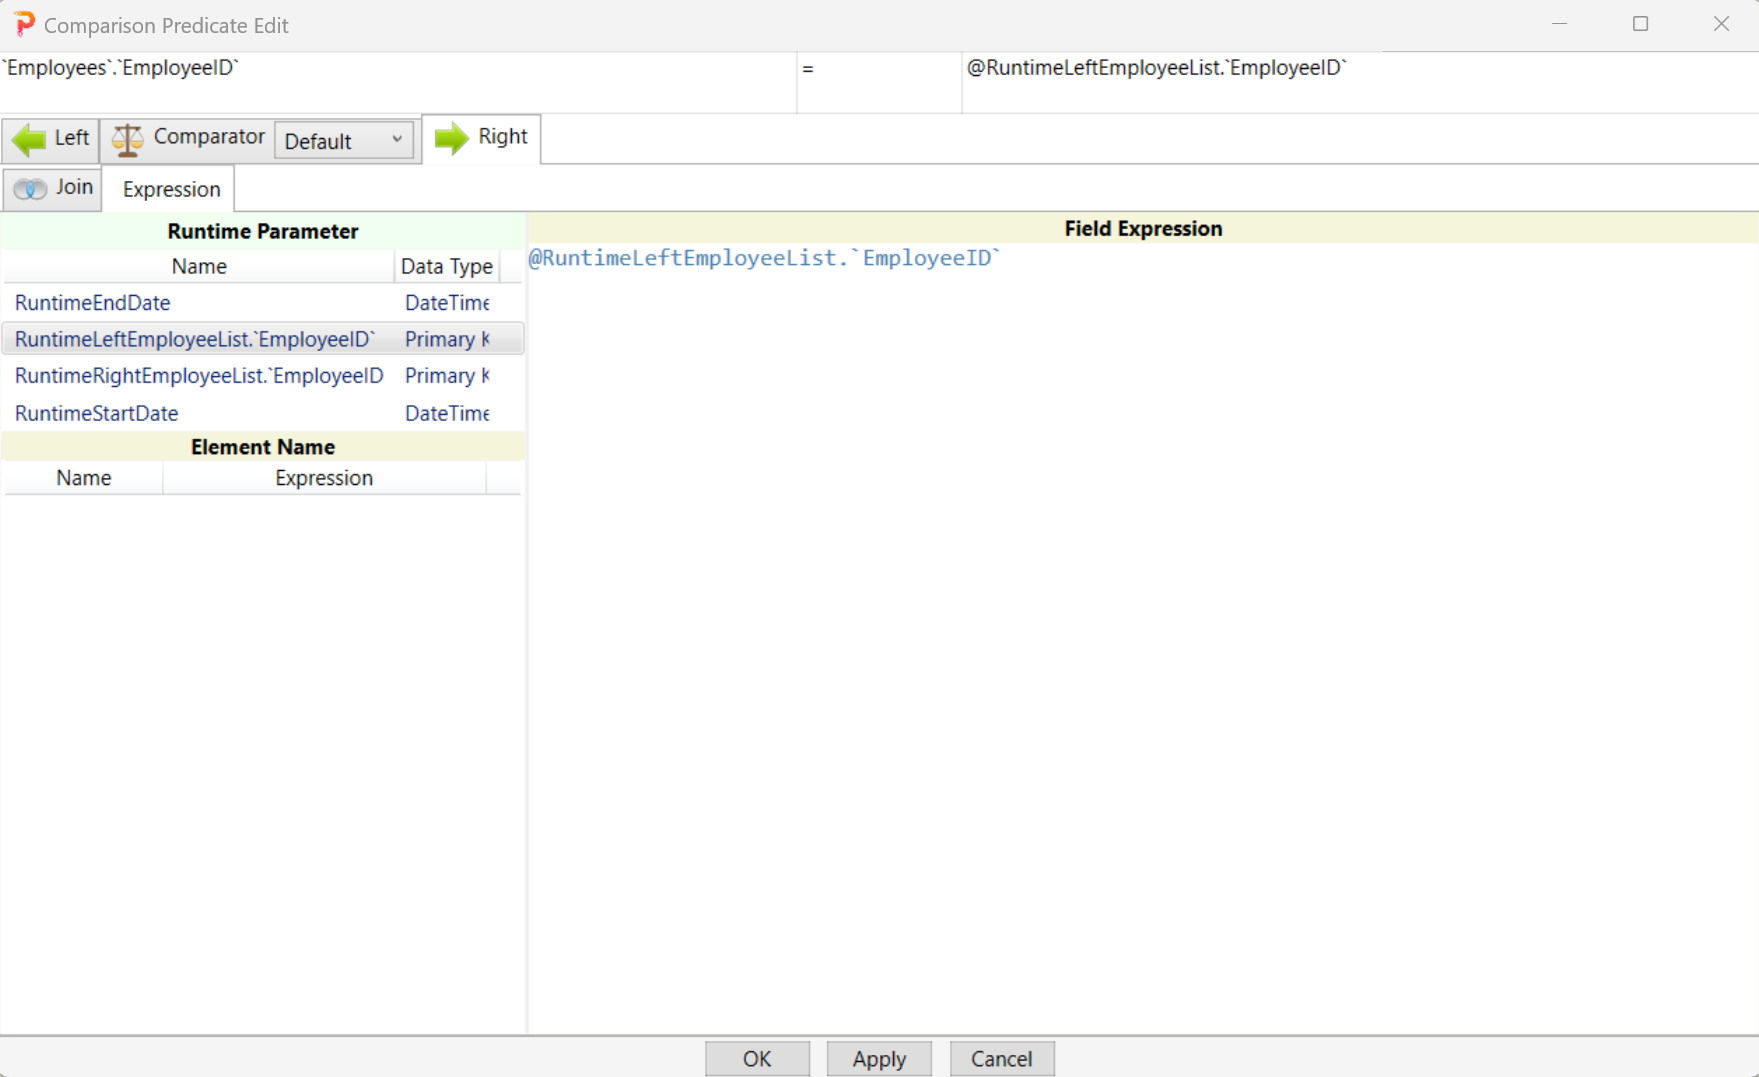
Double-click the OK button to close the dialog box. As you can see, the predicate node has been set with a predicate. This predicate will be incorporated as part of the WHERE clause to select the employee whose EmployeeID is equal to the EmployeeID of the employee chosen by the users at runtime.
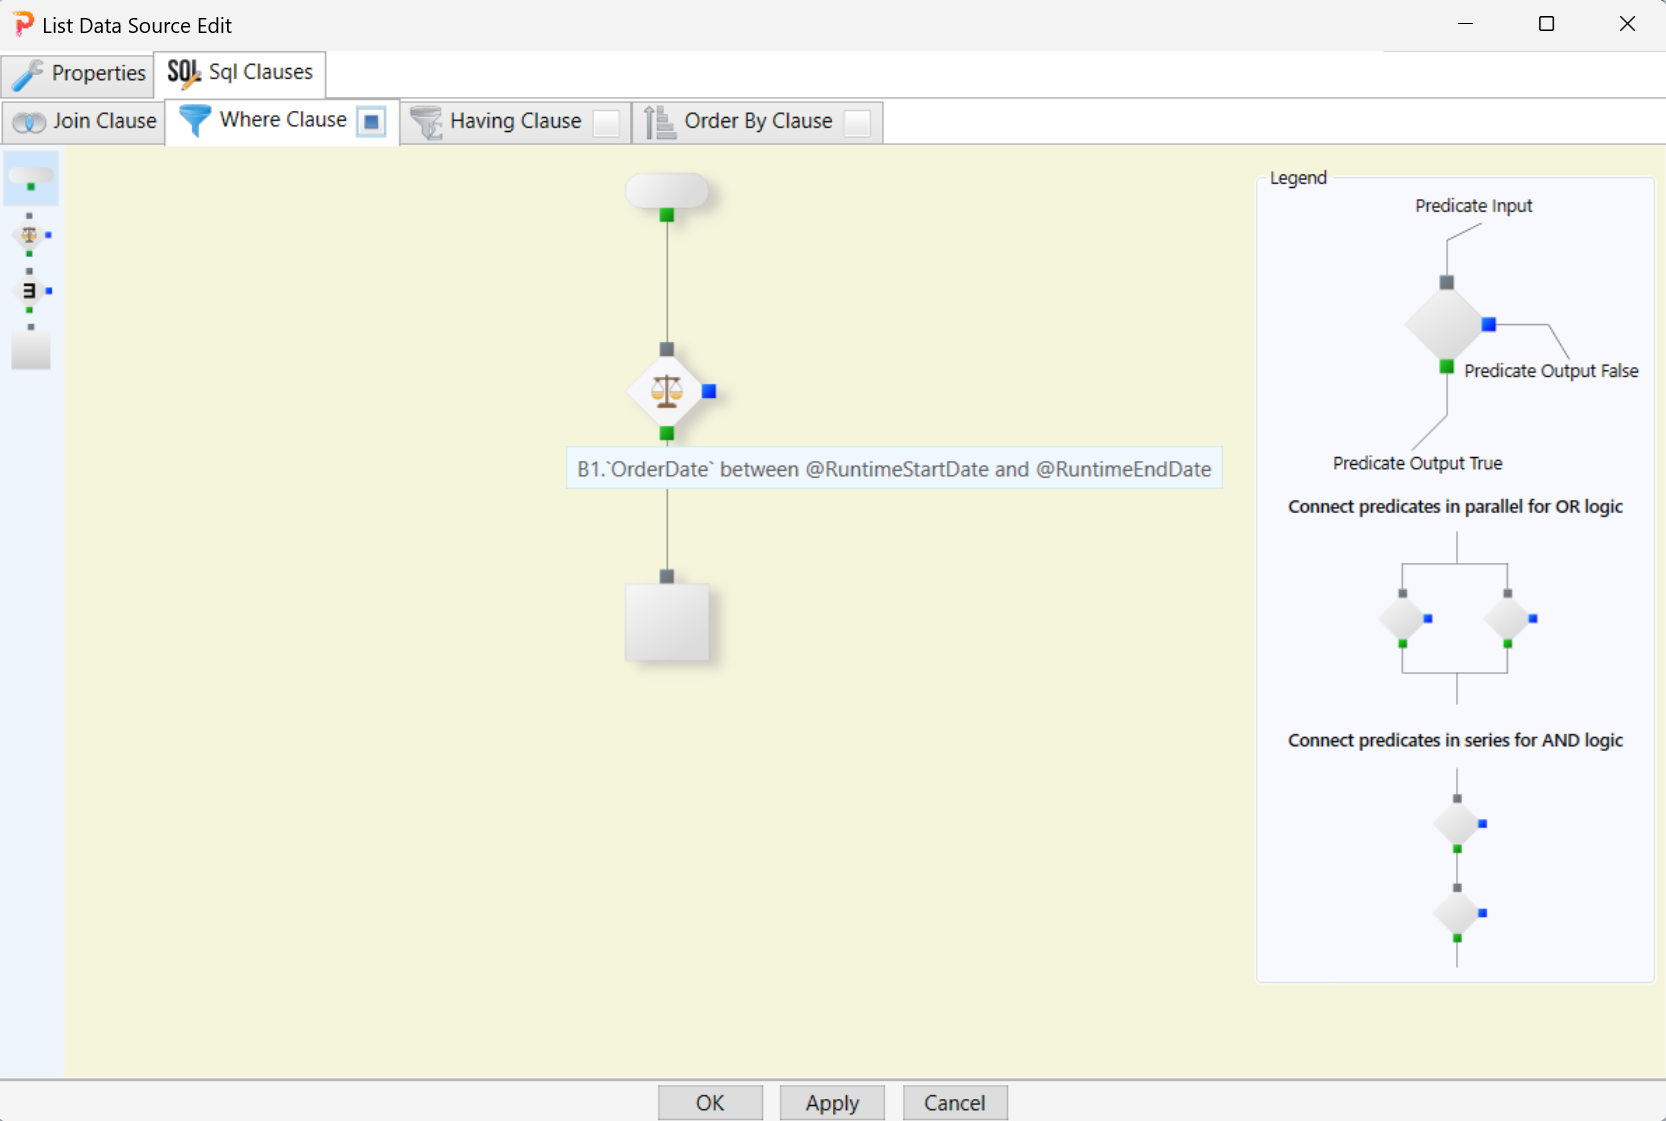
Set the predicate in the predicate node of the flowchart for the second and third-level lists as shown. This predicate will be used in the WHERE clause of the SQL query to retrieve only those Orders where the order dates fall between the two dates chosen by the users at runtime.
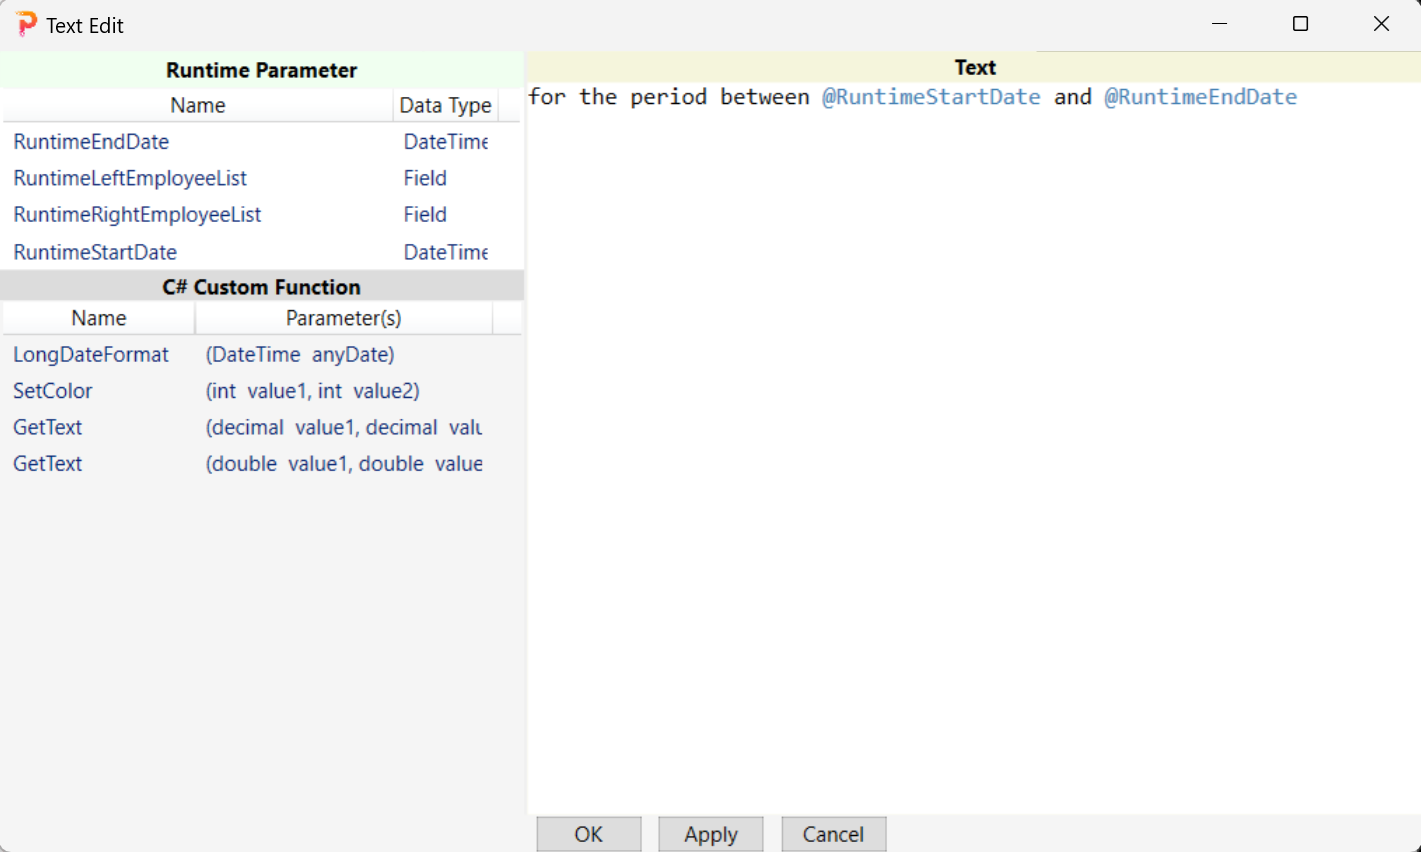
Set the text to show the Start Date and the End Date chosen by the user at runtime
Go to the designer, double-click the text underneath the title, double-click the text underneath the title, and enter the expression as shown.
Run the Preview
Go to the designer and click the Preview tab to run the report. As shown below, the report prompts the user to choose an employee for the left list and an employee for the right list. There is a left list on the canvas, but there is no right list on the canvas yet.
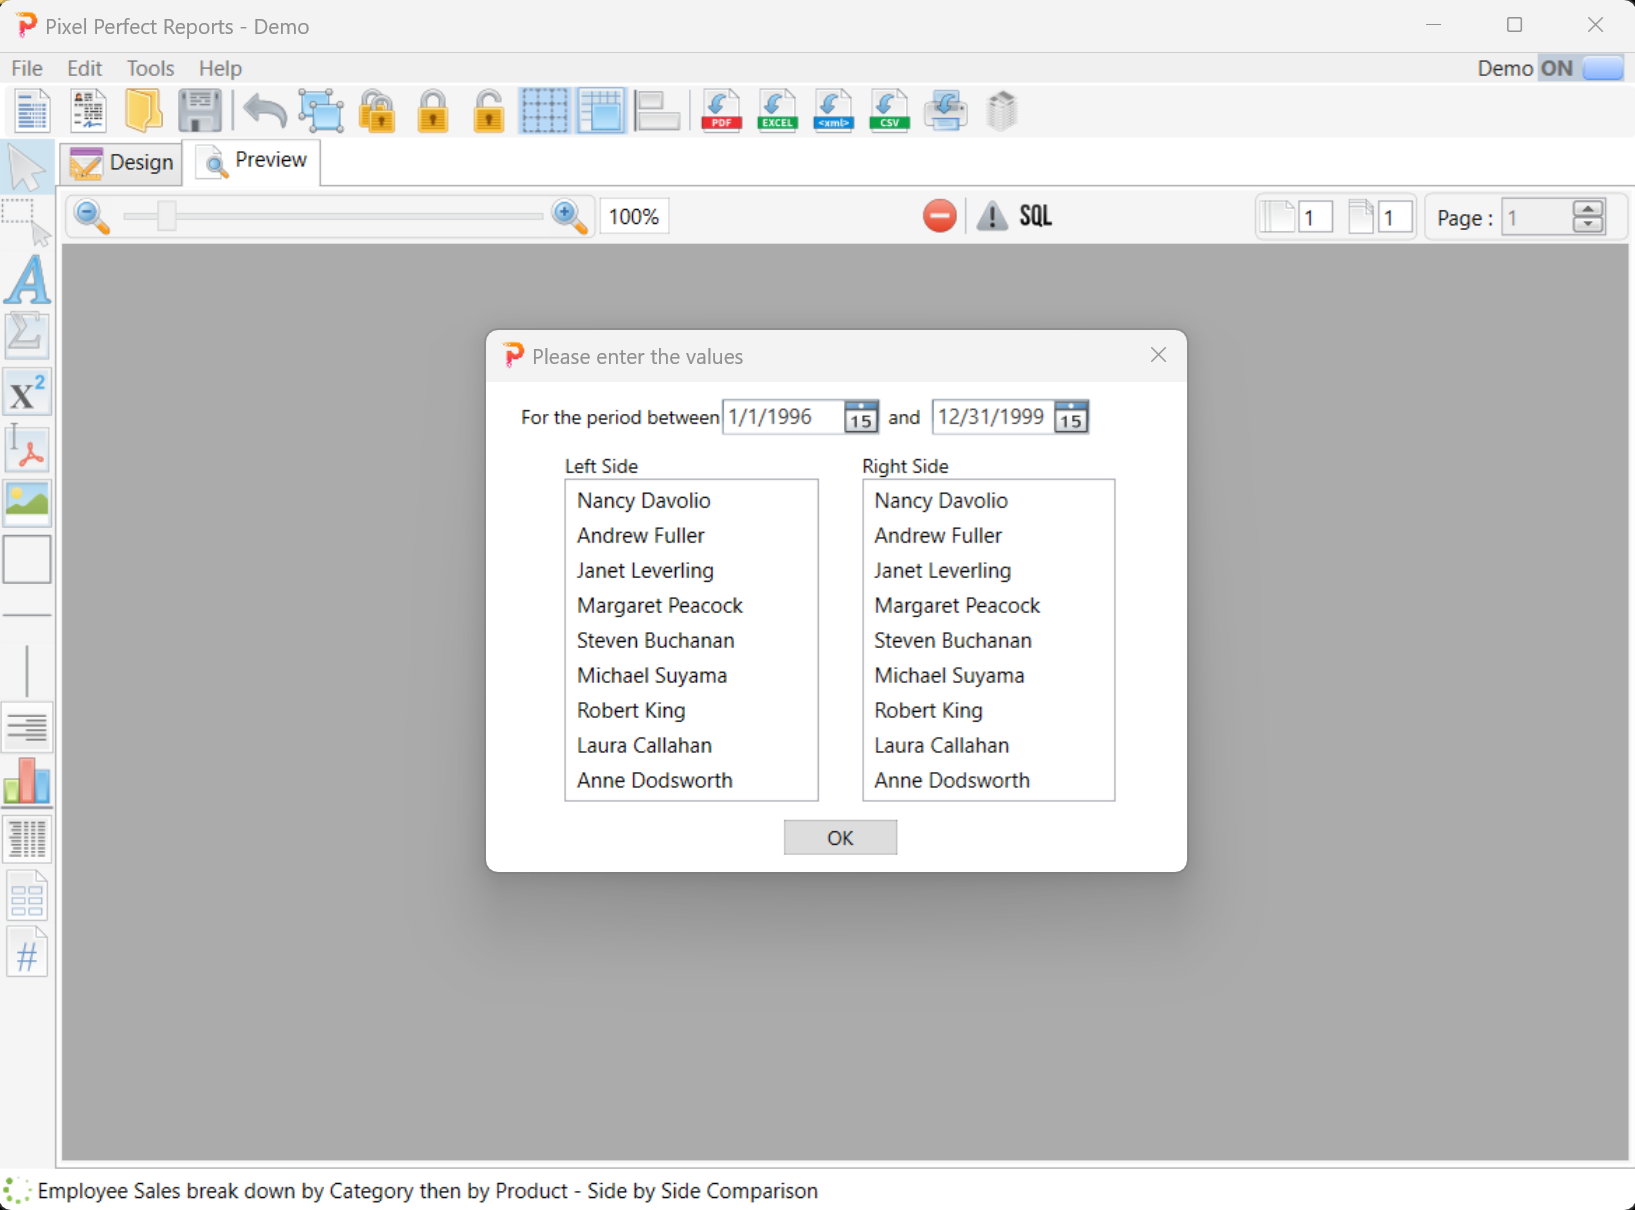
Select an employee on the left side and click the OK button. The list on the left side will now be shown. There is nothing on the right side because we haven't set up the right list yet.

Set up the right list
Let's create a new list and position it to the right of the report. To avoid repetitive work, we can take advantage of the Copy and Paste function in Pixel Perfect Reports. Go to the Design tab and select the list by clicking on it. Right-click the list to bring up the list context menu.

Mouse over to the Copy menu.

Click the Copy menu. Mouse down on the canvas to de-select the list and right-click on the canvas to bring up the canvas context menu.
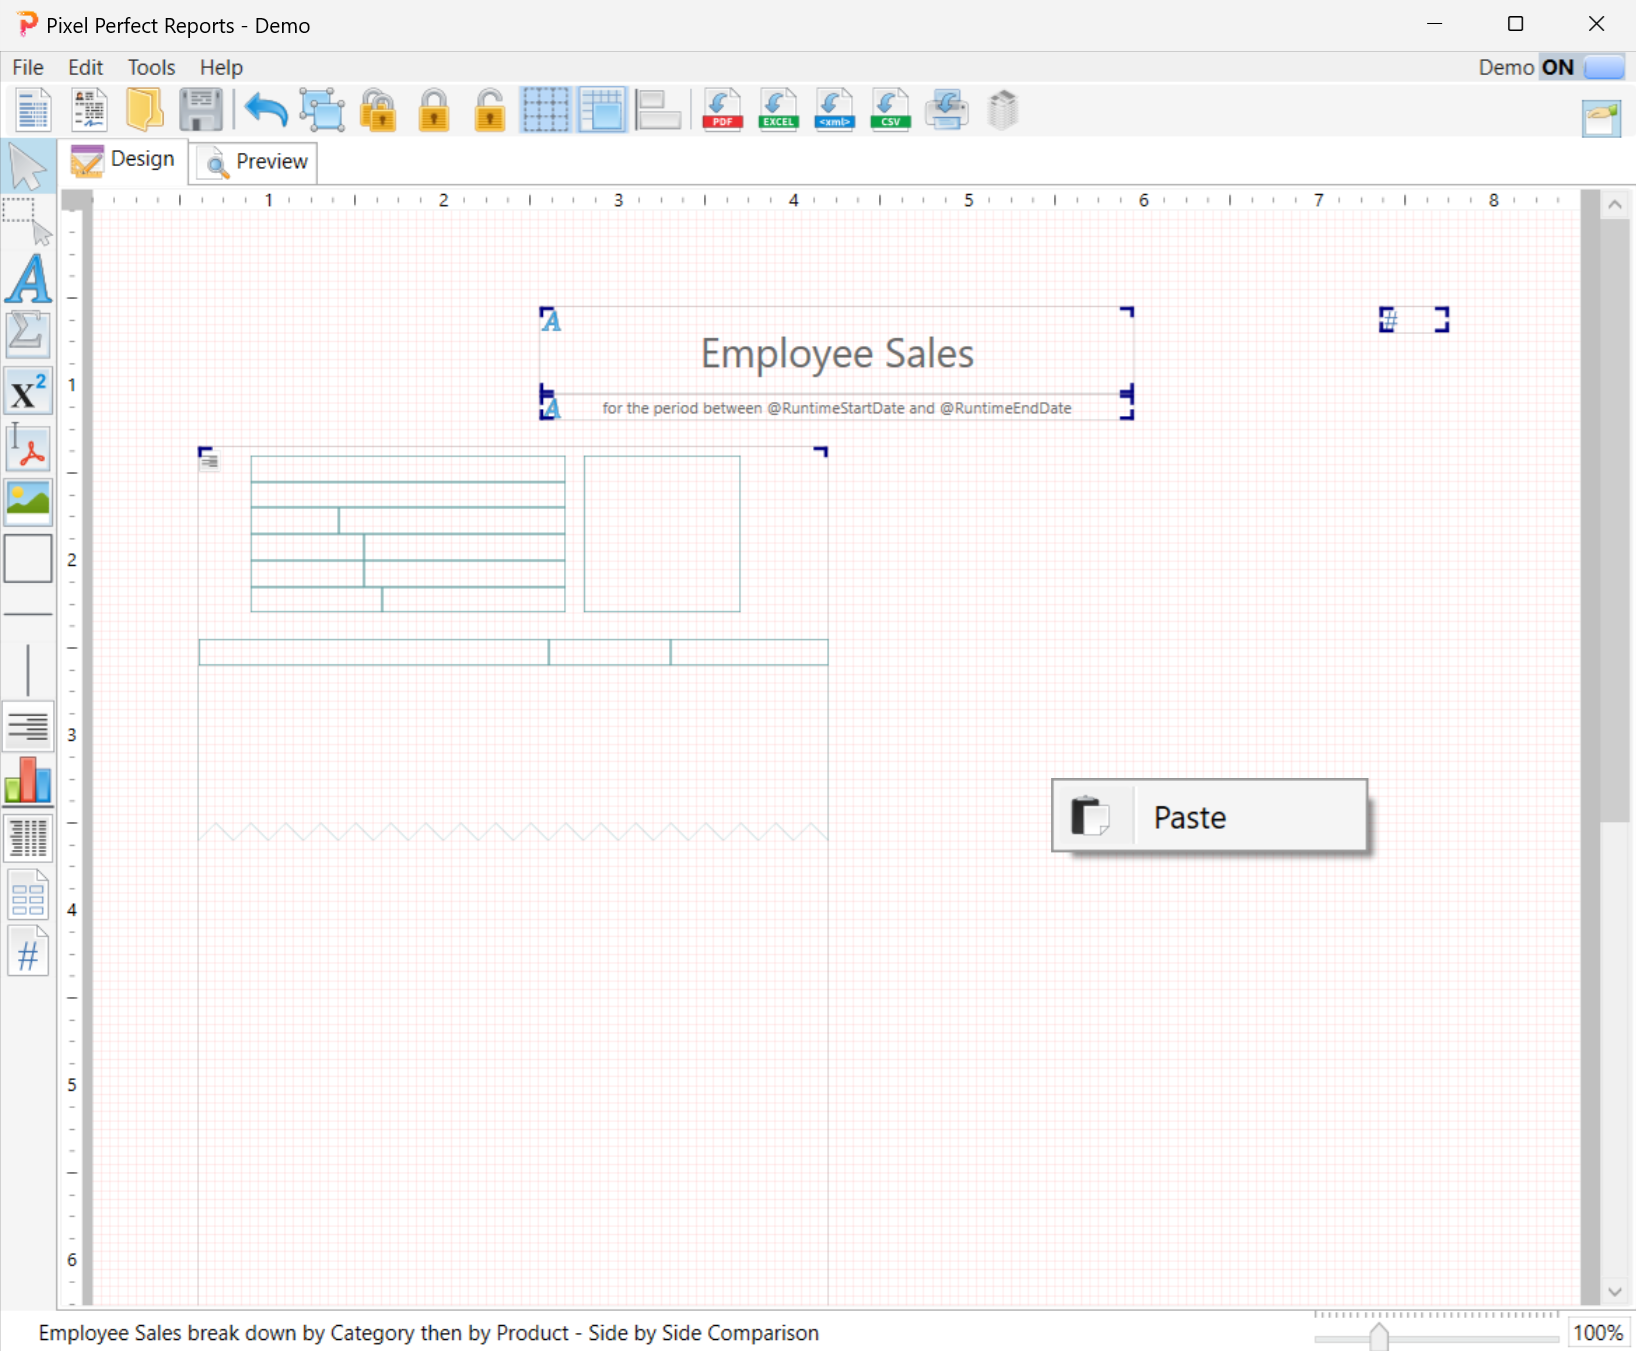
Click on the Paste menu to paste the copied list onto the canvas. As you can see, a copied list has been added to the canvas.
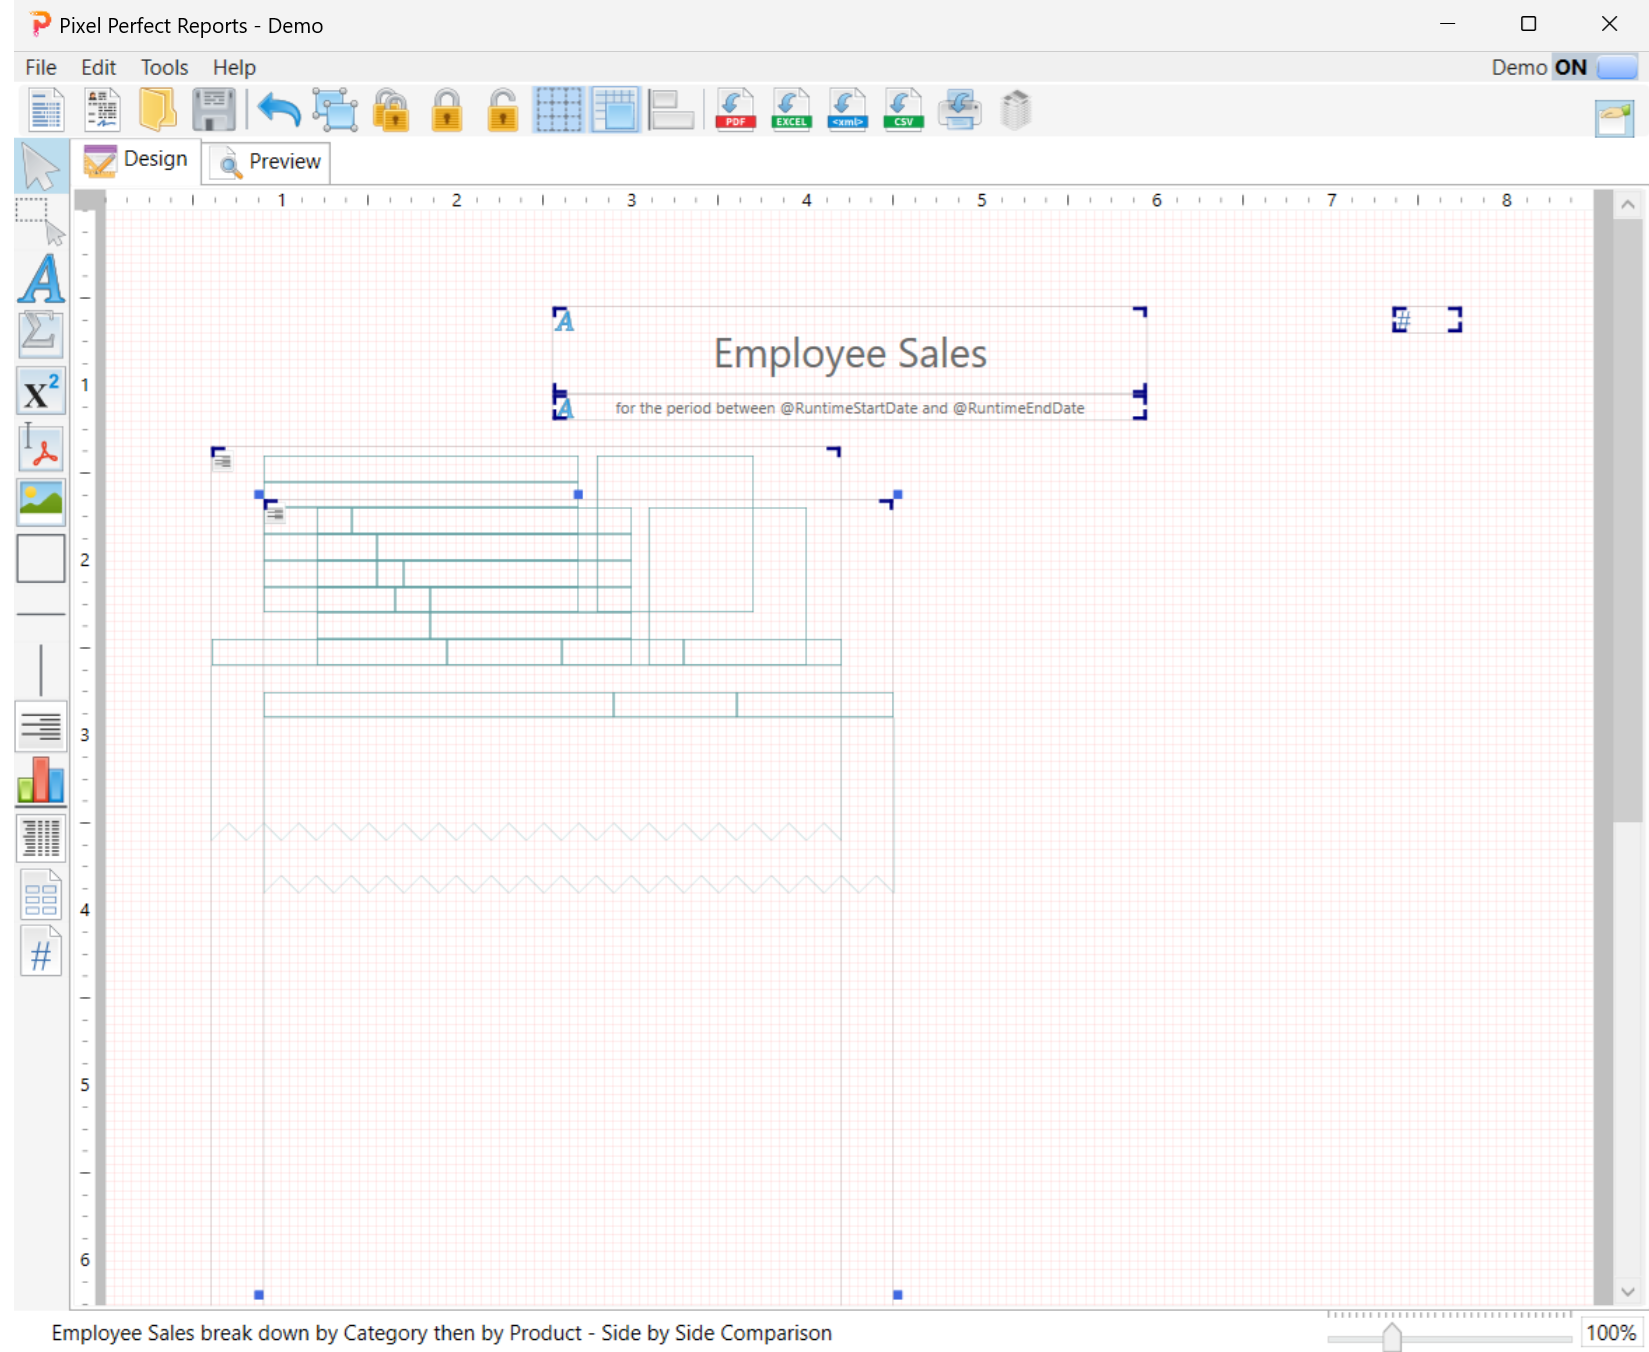
Drag the copied list to the right of the canvas.
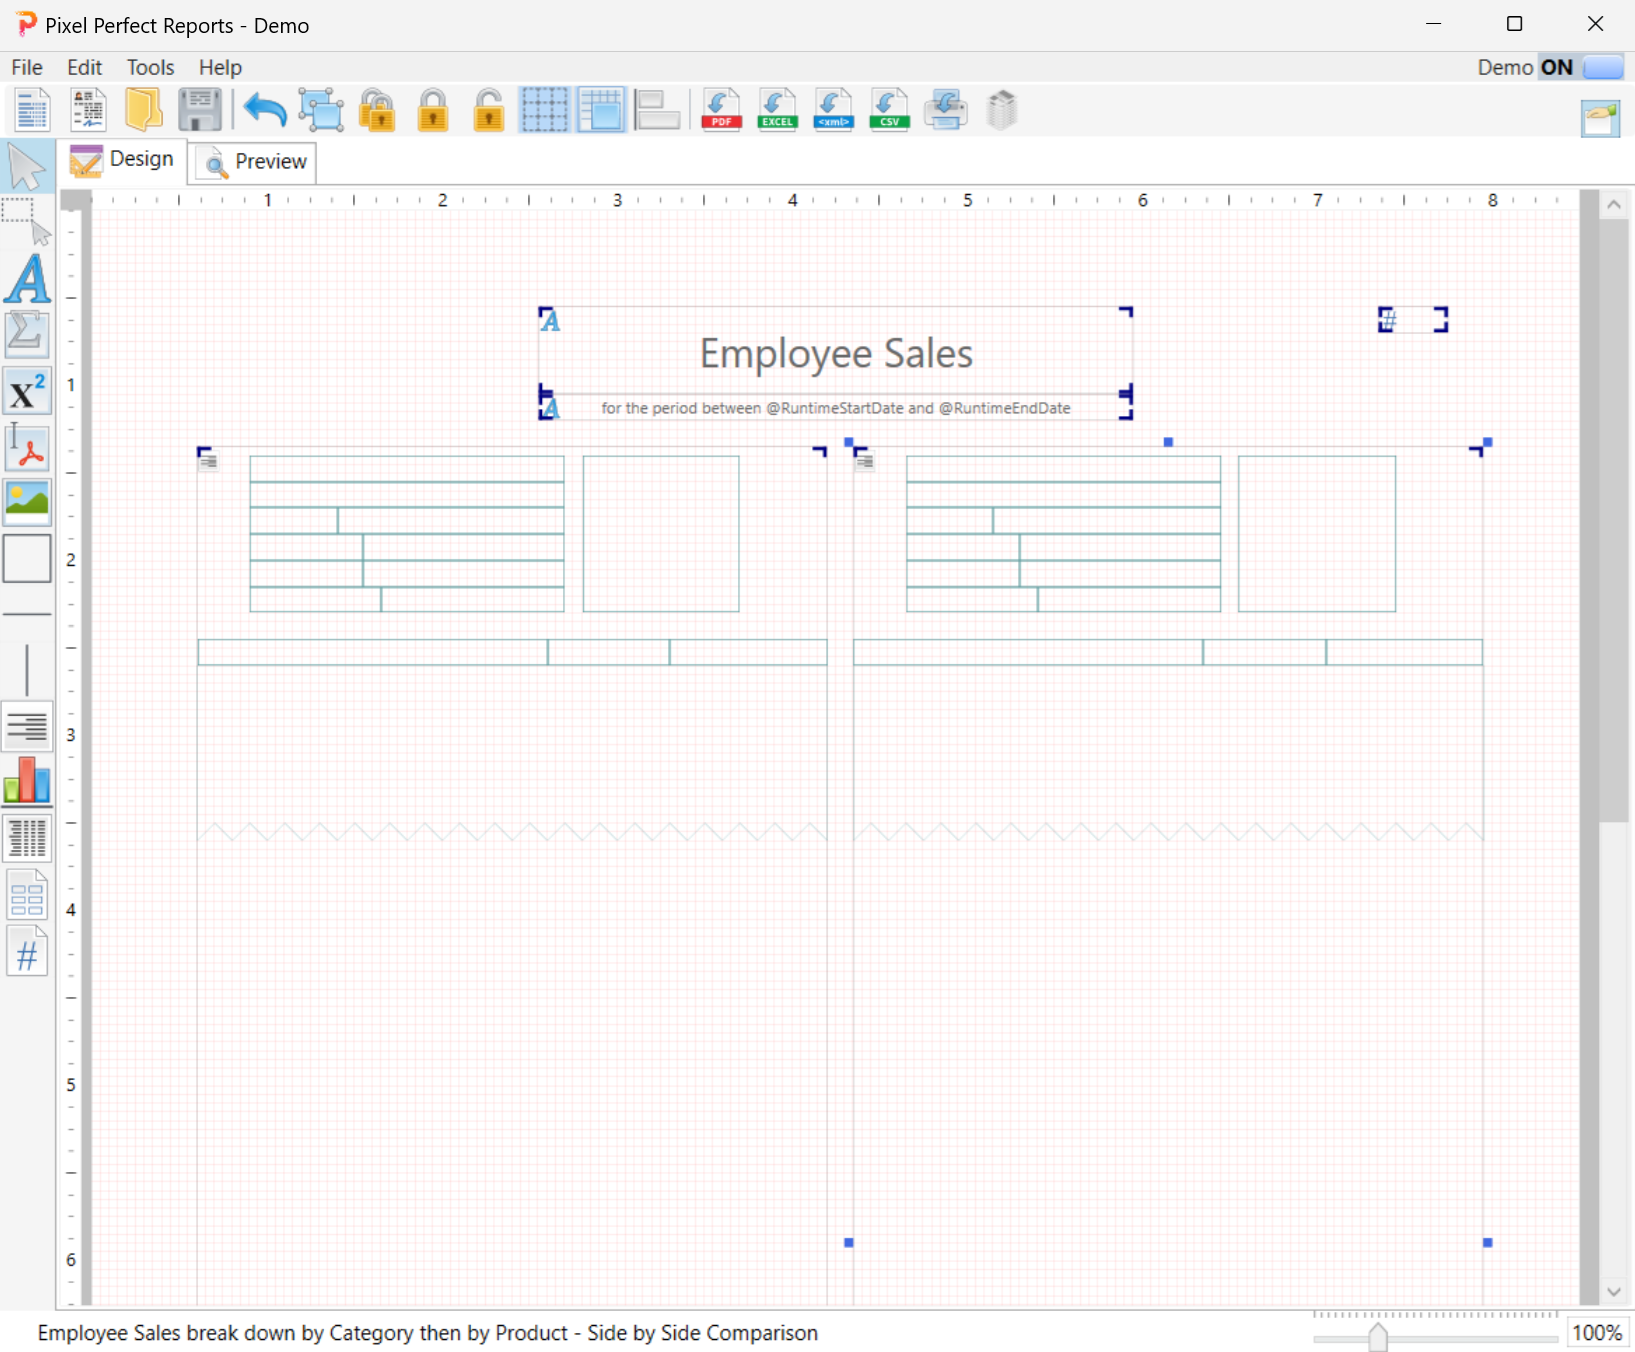
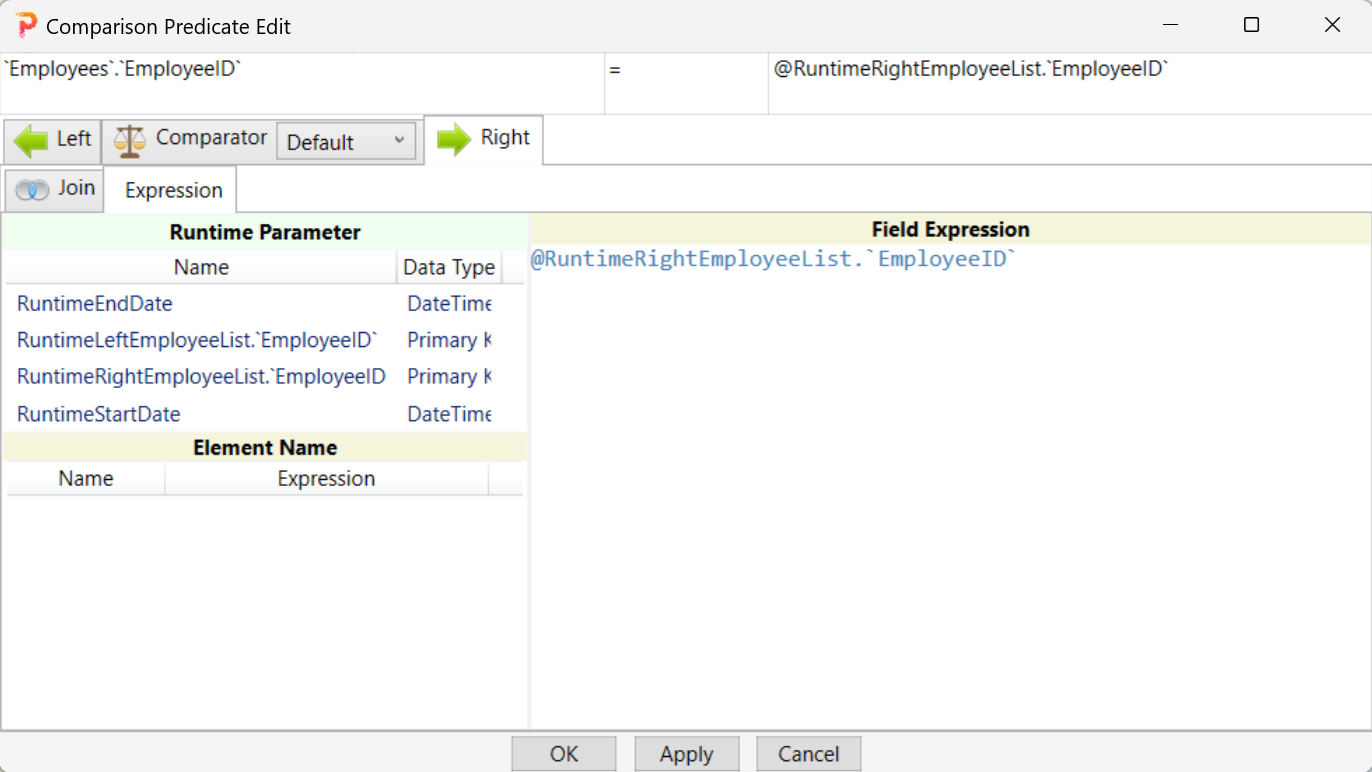
Right now, the two lists are the same. If we run the report, the two lists will display the same data. This is clearly not what we want. We want the right list to display data corresponding to the employee chosen by the user for the right list at runtime. Let's change the employee for the right list. Double-click on the right list and go to the Where Clause tab. If you mouse over to the predicate note, you can see the predicate shows that the list is pointing to the employee chosen for the left list. We need to change that to the right list.
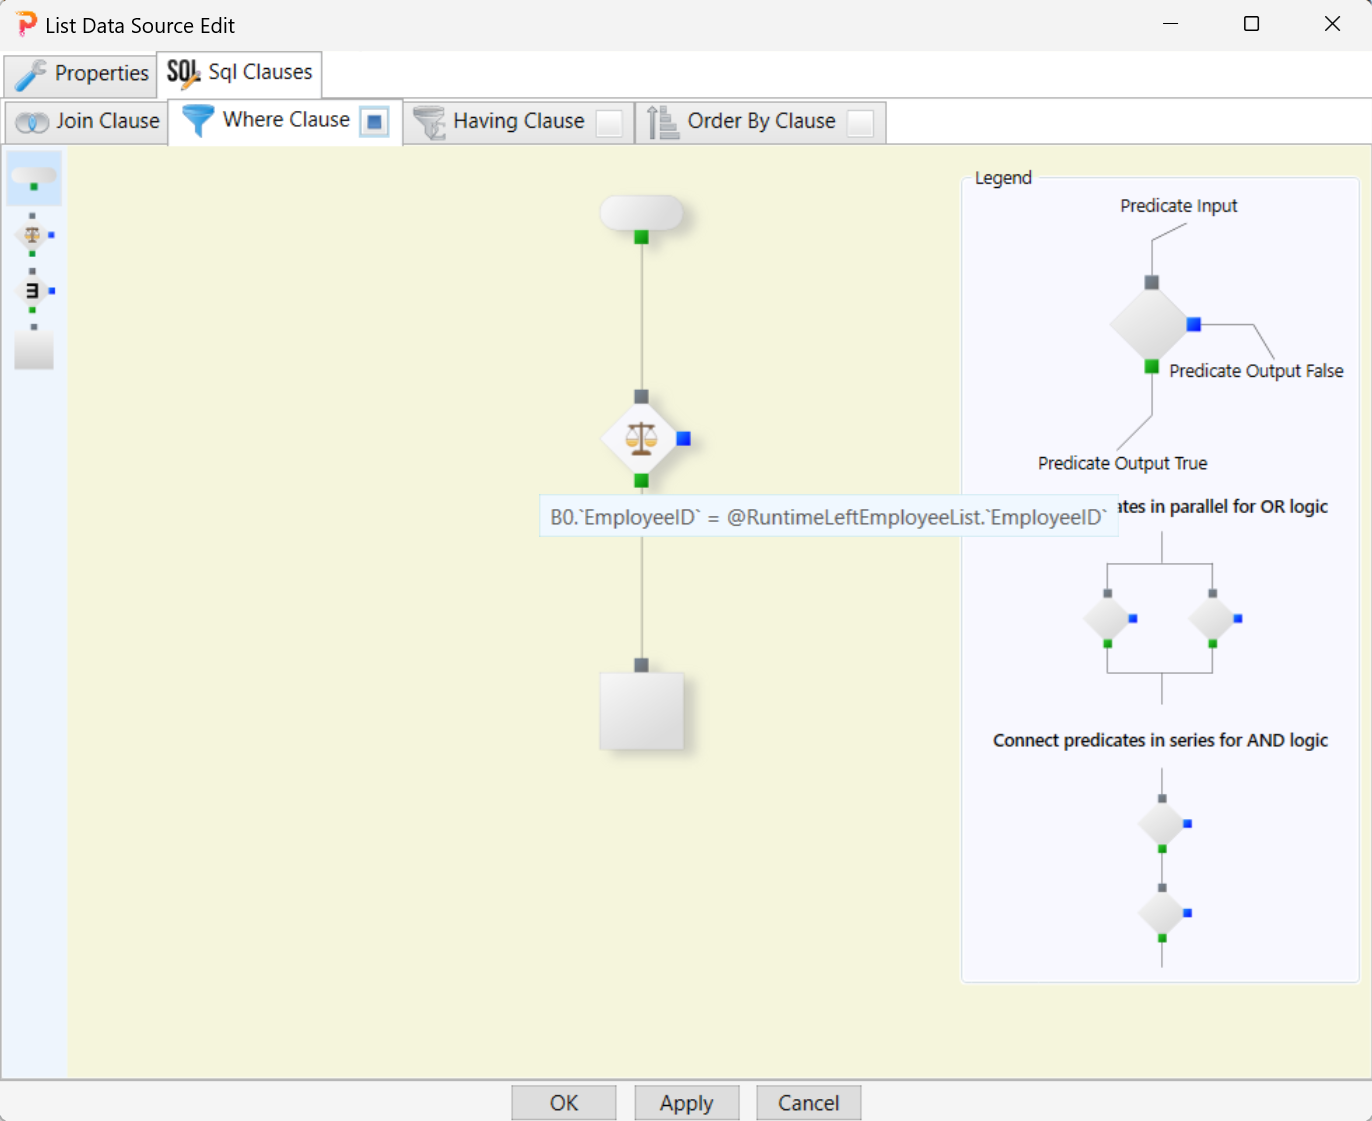
Double-click the predicate node and go to the Right tab and then the Expression tab.
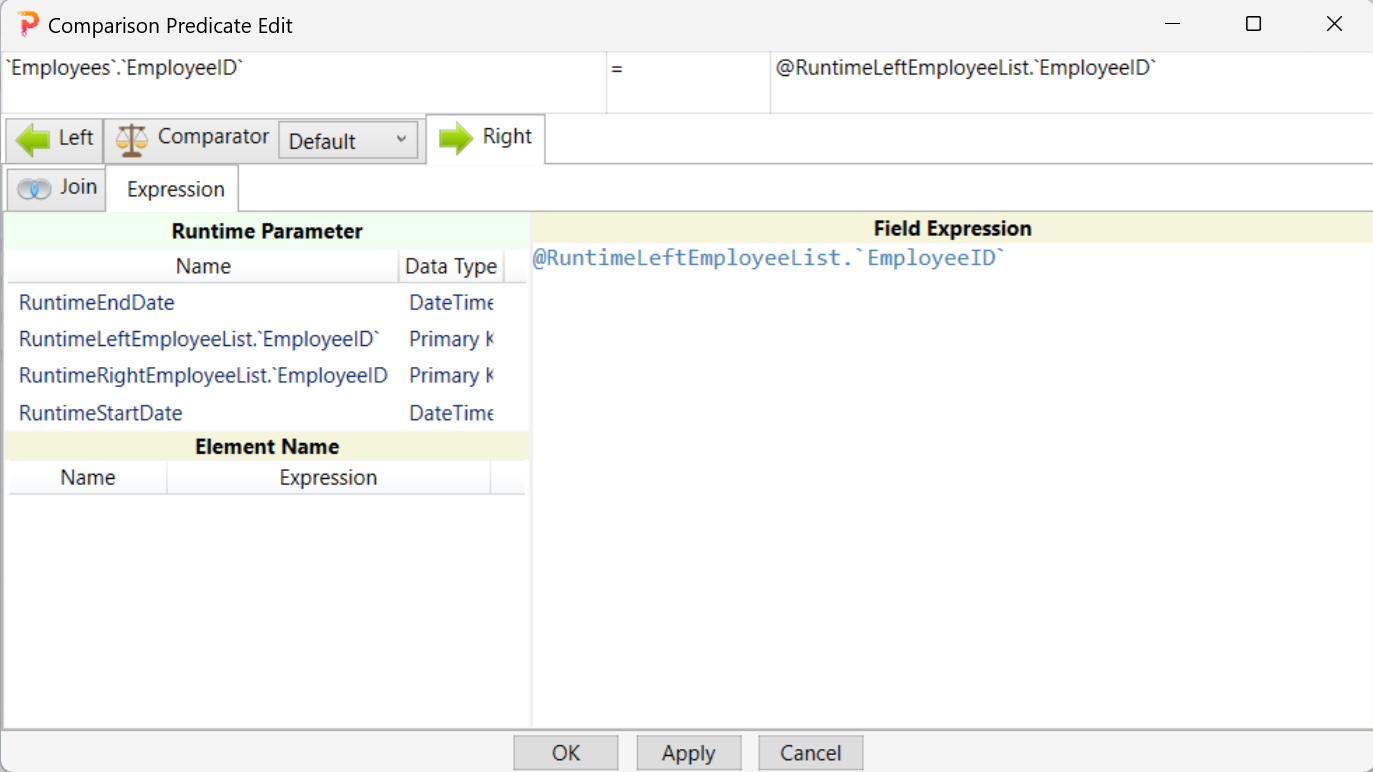
Edit the expression in the right pane so that it refers to the right employee.
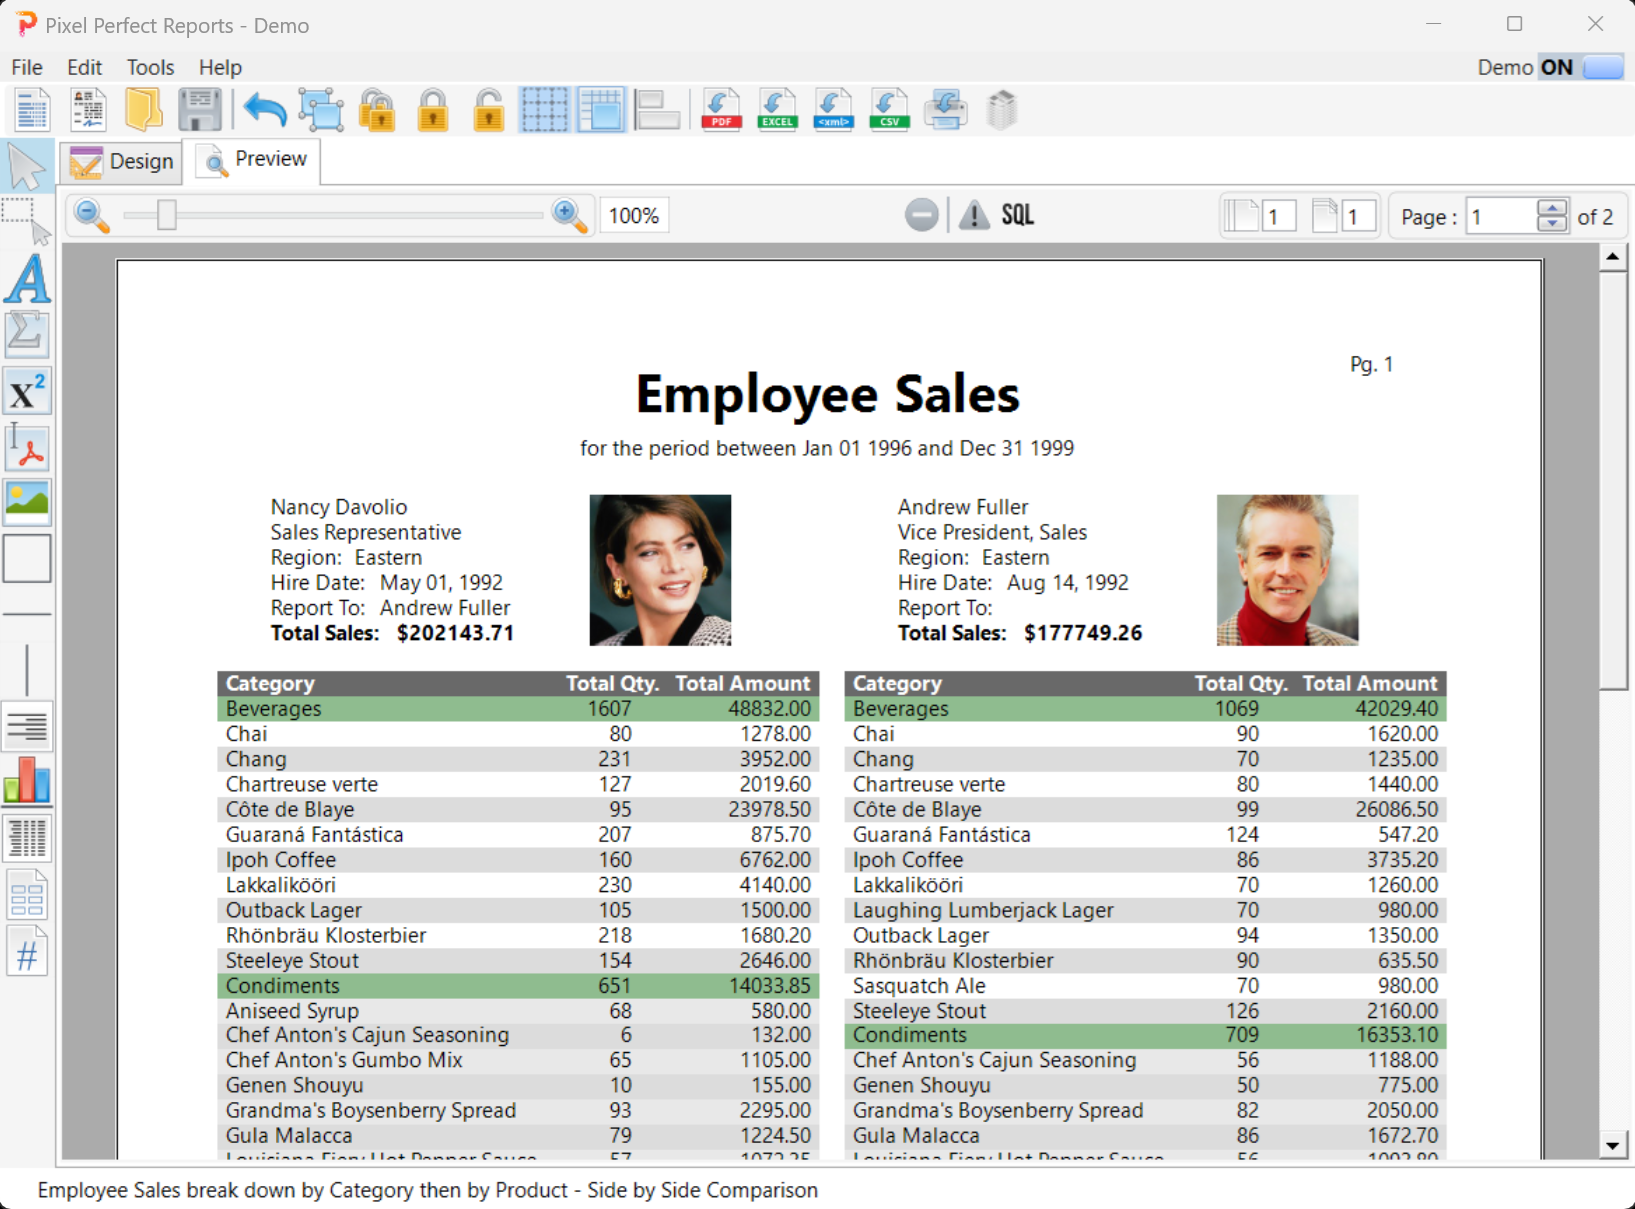
Go to the first level of the Designer and run the report again by going to the Preview tab. Select an employee on the left list and an employee on the right list.
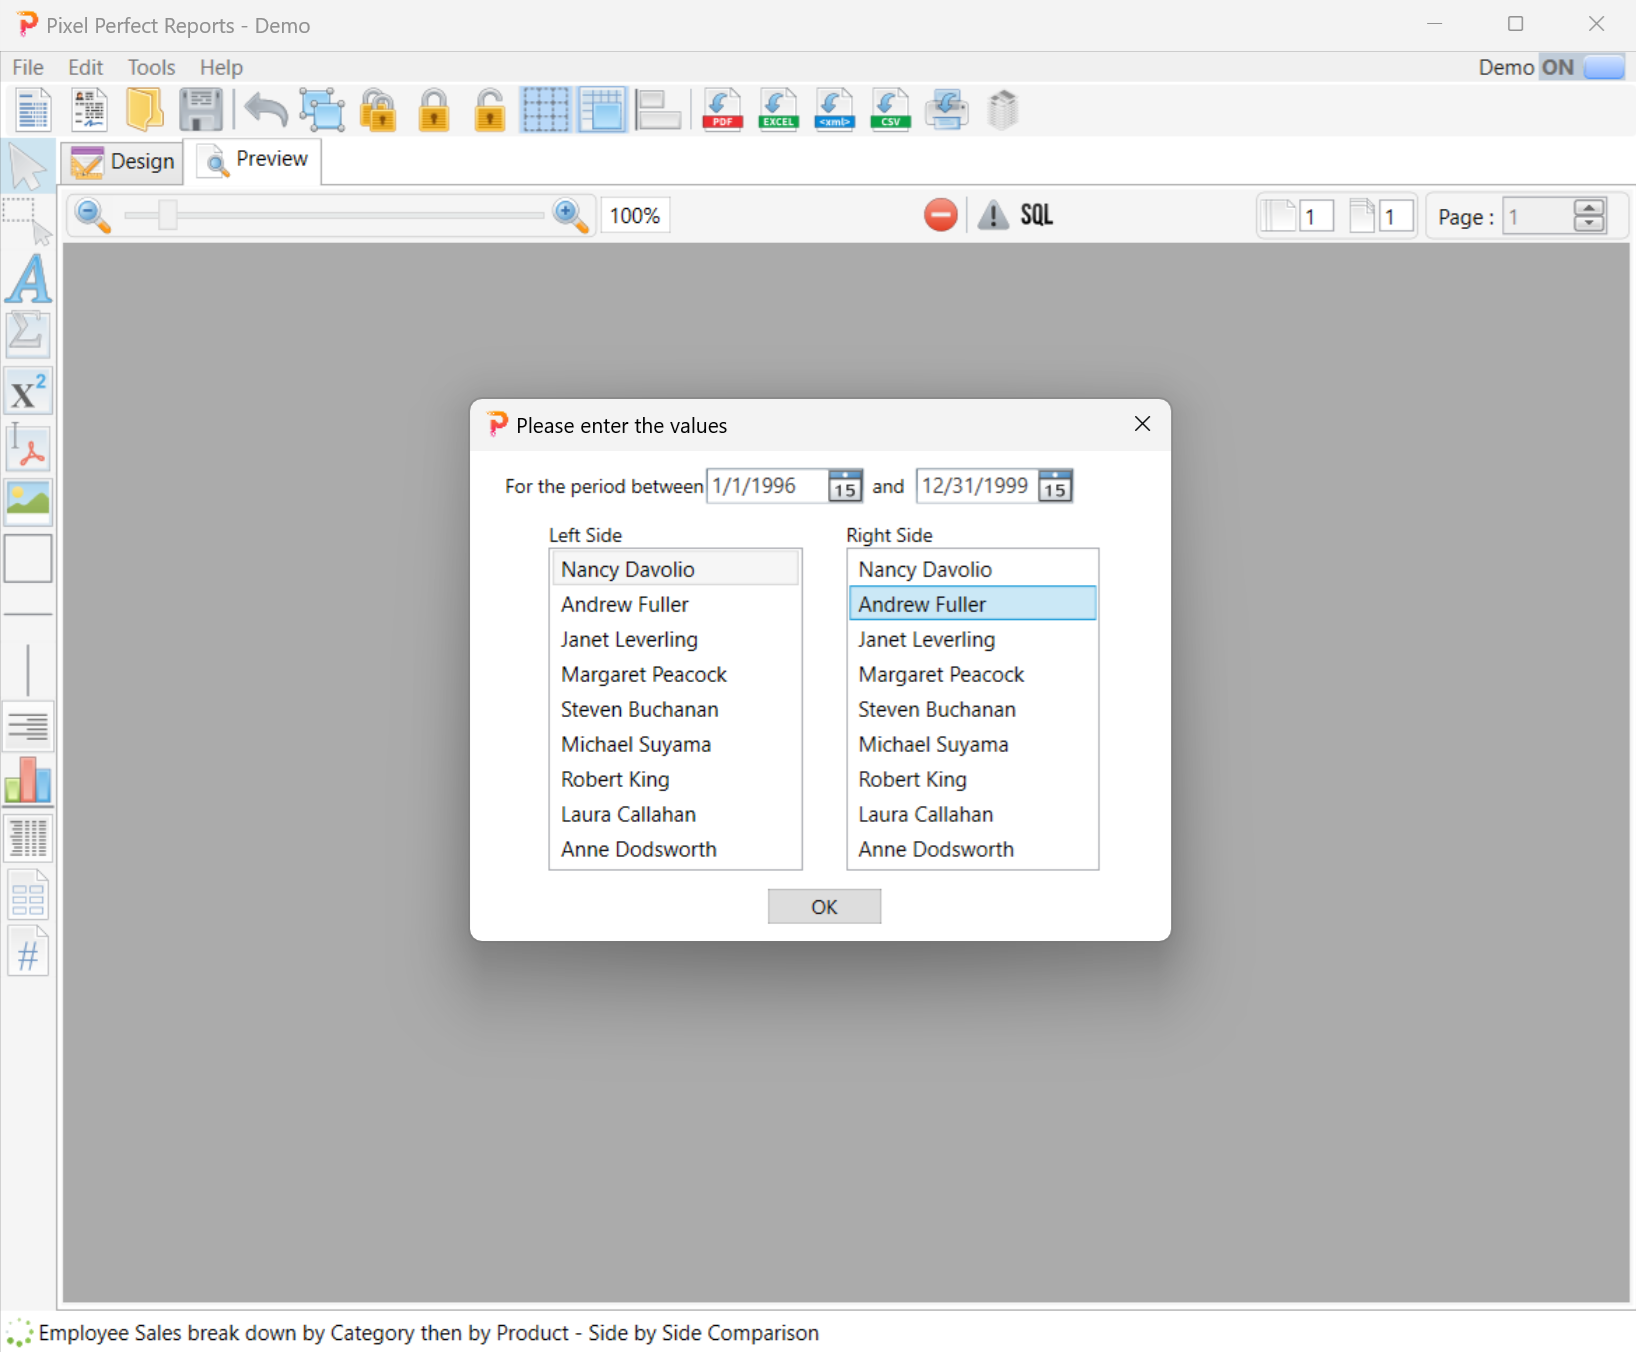
Click the OK button to confirm the selection and run the report.
Comparison to other reporting tools
Other SQL reporting tools, such as SSRS, Active Reports, and DevExpress, allow users to display two tables side by side using a similar mechanism: You put the two tables on a container such as a rectangle. This works only if the tables do not contain subreports, whereas Pixel Perfect Reports does not have such constraints, as demonstrated above.
Comparison to SSRS
In SSRS, users can display two tables side by side by putting the two tables on a rectangle.
Display tables side by side in ssrs – SQLServerCentral Forums
Comparison to Active Reports
In Active Reports, users can display two tables side by side by putting the two tables on a rectangle.
Create Side-by-Side Reports Using Tablix in ActiveReports Professional | ActiveReports (mescius.com)
Comparison to DevExpress
In DevExpress, users can display two tables side by side by putting the two tables on a rectangle.
Create a Side-by-Side Report | .NET Reporting Tools | DevExpress Documentation
Comparison to Crystal Reports
Crystal Reports does not allow the display of two tables positioned side by side.
Crystal Reports 2 details side by side (crystalreportsbook.com)
Conclusion
Pixel Perfect Reports is the only SQL reporting tool on the market that offers the cleanest way to display hierarchical data, including hierarchical data positioned side by side with no constraints.